 Previous Page Next Page
Chart Wizard (Business View Based)
The wizard differs for a normal chart and a KPI chart.
For normal chart
The wizard appears when you do one of the following:
The wizard helps you create a chart in a library component or page report, or modify an existing chart, and consists of the following screens:
Back
Goes back to the previous screen.
Next
Goes to the next screen.
Finish
Finishes creating or modifying the chart and closes this wizard.
Cancel
Does not retain changes and closes this wizard.
Help
Displays the help document about this feature.
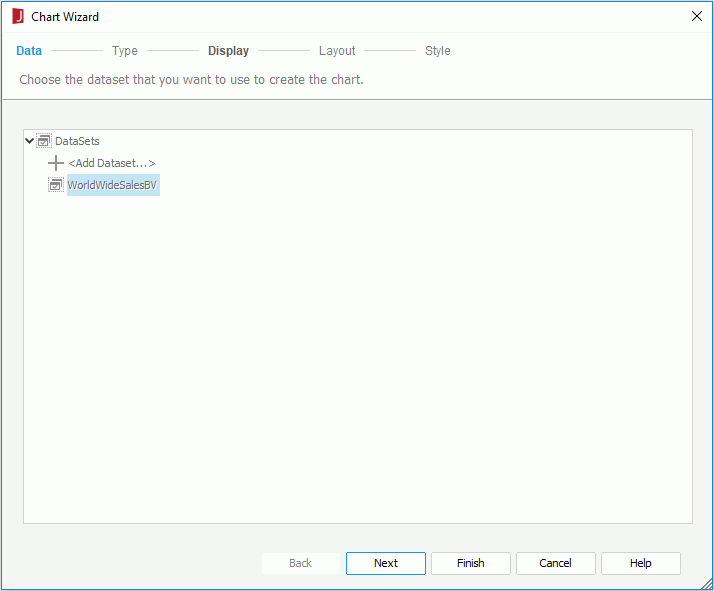
Data
Specifies the business view for the chart.
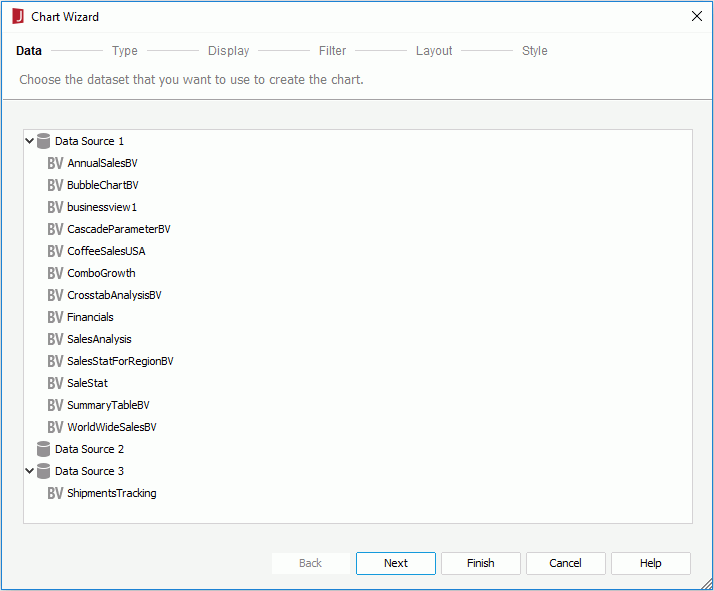
Resources
Lists all the business views in the current catalog. Specify the one you want to use.
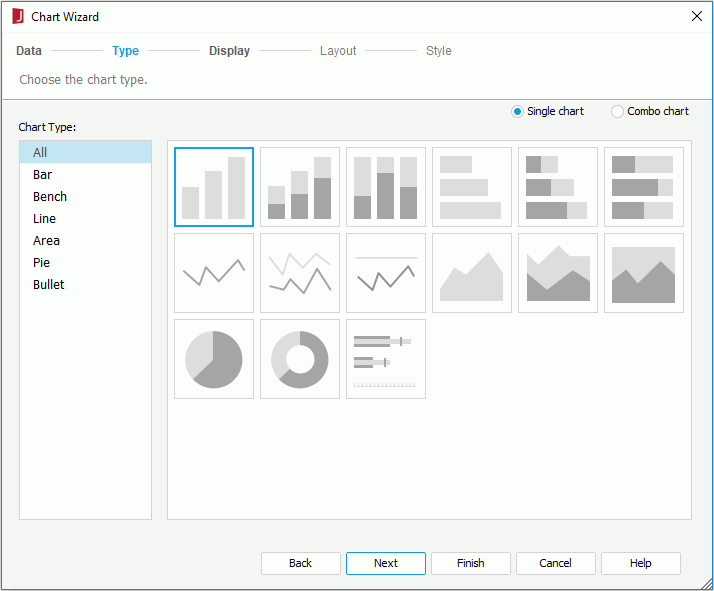
Type
Specifies the type of the chart. You can refer to the section Chart Types which describes each of the chart type in detail. Only the 2-D chart types are supported.
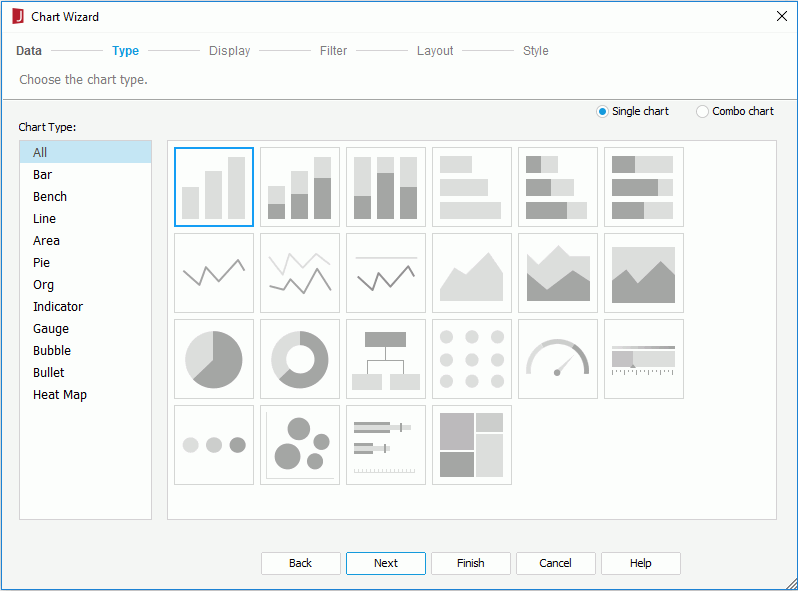
Single chart
Specifies to create a single chart.
- Chart Type
Lists all the chart types that can be used to create a single chart.
- Subtype
Lists all the subtypes of the selected chart type. Hover the mouse pointer on a subtype icon and you will see its name.
Combo chart
Specifies to make more than one type use the primary or secondary axis. The types should be featured as combination charts. Two types of data markers are used to represent different data values.
- Chart Type
Lists all the chart types that can be added as a combo chart.
- Subtype
Lists all the subtypes of the selected chart type. Hover the mouse pointer on a subtype icon and you will see its name.
- Chart Type Groups
Lists all the chart types that are to be used in the combo chart.
- Primary Axis
- <Add Combo Type>
Adds a chart type to the primary axis.
- Secondary Axis
- <Add Combo Type>
Adds a chart type to the secondary axis.

Removes a specified chart type from the Chart Type Groups box.
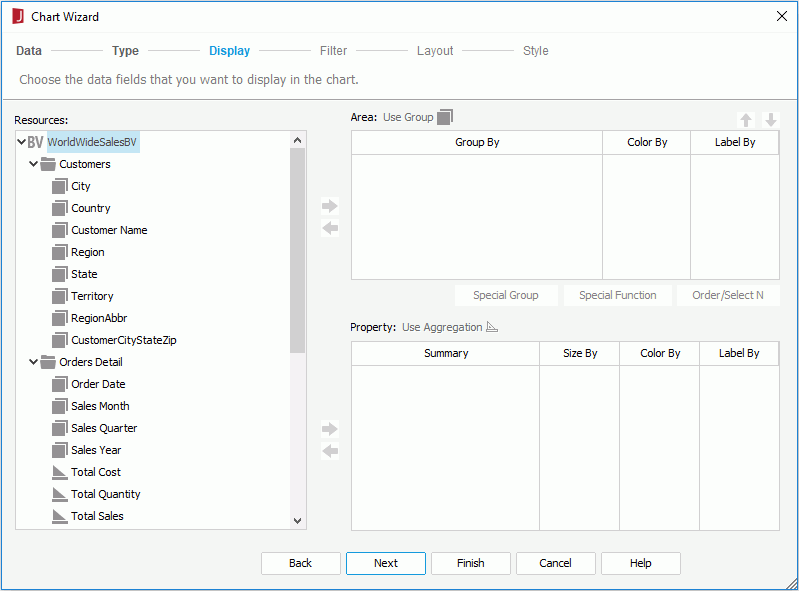
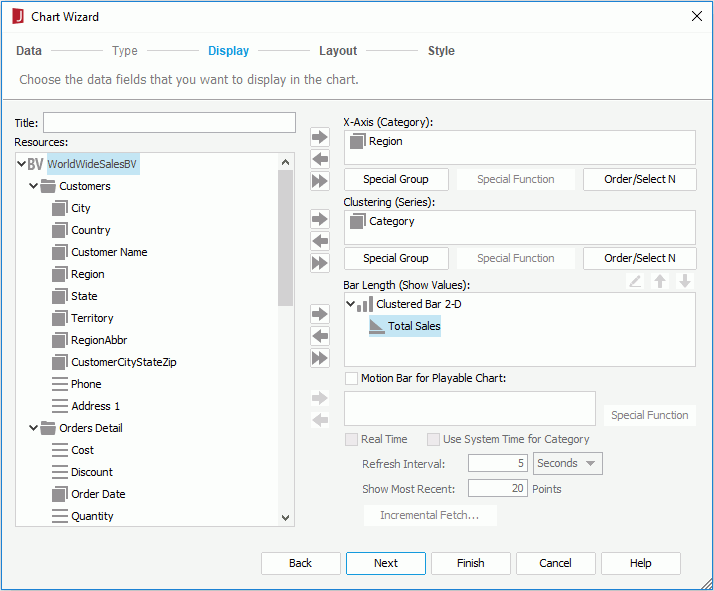
Display
The Display screen differs with chart types: common chart types, organization chart, or heat map.
For common chart types
Specifies the data displayed on the chart.
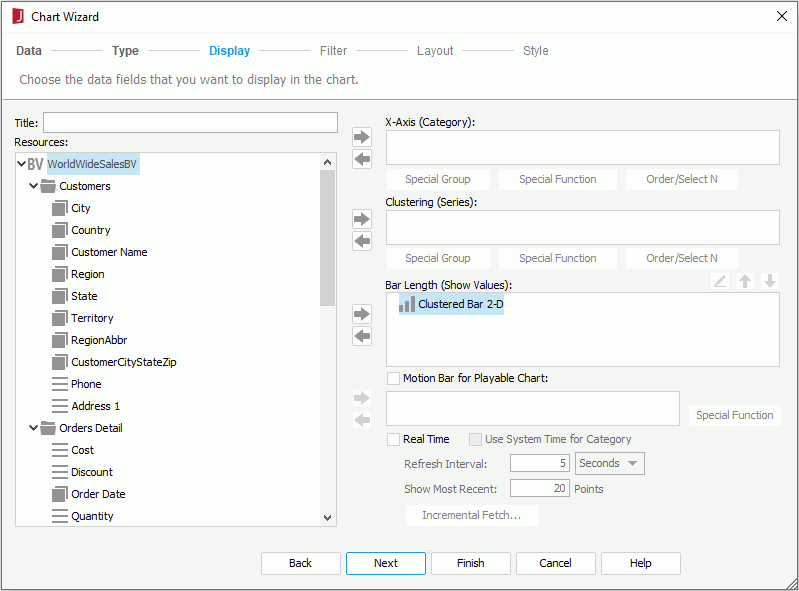
Title
Specifies the title of the chart.
Resources
Lists all the available data resources in the selected business view. You can also create dynamic formulas and aggregations to use in the chart in a web report or library component.

Adds the selected fields to be displayed in the chart.

Removes the selected fields from the chart if they are not required.
Category/Series
The box lists the field you want to display on the category/series axis of the chart.
For a real time chart, if no category field is specified, Use System Refresh Time will be automatically displayed in the Category box, namely, the time at which the chart refreshes itself will be used as the category value; the series axis will be disabled.
- Special Group
Opens the User Defined Group dialog to define how to group information.
- Order/Select N
Opens the Category Options dialog or Series Options dialog to specify the sort order of the category or series values and define the number of the category or series values that will be displayed in the chart.
Show Values
Lists the values you want to show in the chart. For a real time chart, the values you add must be of Numeric type and cannot be summary fields.

Opens the Edit Additional Value dialog to edit an additional value. Available only when a constant value or an average value is selected.
Moves the selected value one step up. 
Moves the selected value one step down.
Adds a new pair of Y Axis and Radius for the bubble chart.
Removes the selected field from the bubble chart if they are not required. - X Axis
Lists the value you want to show on the X axis of the bubble chart.
- Y Axis
Lists the value you want to show on the Y axis of the bubble chart.
- Radius
Lists the value you want to show as the bubble radius.
Motion Bar for Playable Chart
Lists the field you want to use as the motion field. A motion field can only be of Integer, Date or Time data type. Available to single bar, bench and bubble charts in web reports and library components only.
- Special Function
Opens the Special Function dialog to define some special function to the motion field. Available only when the motion field is of Date data type.
Real Time
Specifies to run the chart in real time mode, which means it will be updated automatically by using real time data after it is published to JReport Server. Available to single bar, bench, line, and area charts in web reports and library components only.
- Use System Time for Category
Specifies to use the time at which the chart refreshes itself as the category value.
- Refresh Interval
Specifies the time interval at which the chart will get data and refresh itself automatically.
- Show Most Recent N Points
Specifies the number of points that will be kept for the real time data on the chart.
- Incremental Fetch
Opens the Unique Key dialog to configure a unique key for the real time chart.
For organization chart
Specifies the data displayed on the chart.
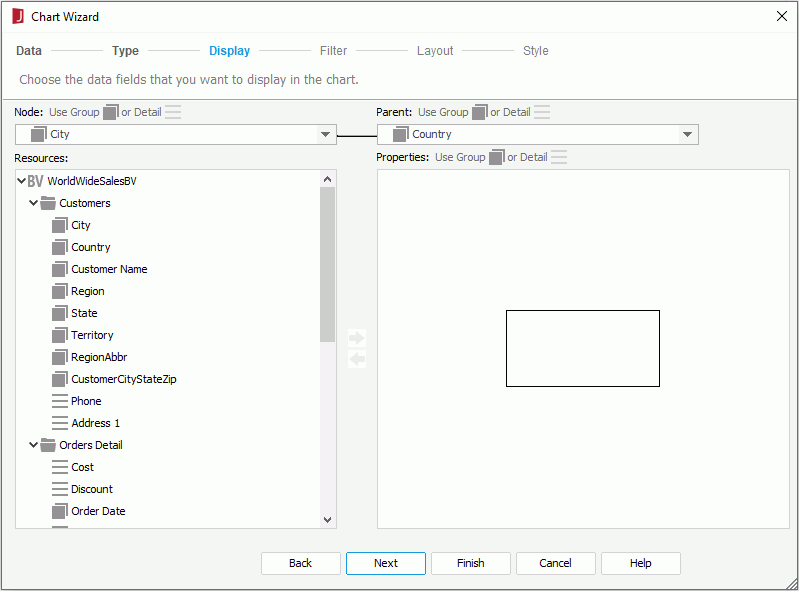
Node
Specify a field from the drop-down list which identifies the entity.
Parent
Specify a field from the drop-down list which shows the "reporting to" relationship among the entity members, that is, which child field member reports to or belongs to which child field member.
Resources
Lists all the available resources that can be added to the organization chart. You can also create dynamic formulas and aggregations to use in the chart in a web report or library component.
Properties
The Properties box presents a node model of the organization chart. Data fields, labels and images can be inserted into the node as the information about the entity in the organization chart.
For heat map
Specifies the data displayed on the chart.
Resources
Lists all the available data resources in the selected business view. You can also create dynamic formulas and aggregations to use in the chart in a web report or library component.
Area
Lists the fields used to group the data to different areas. There should be at least one group. When there are multiple groups, their levels are defined by their positions from top down. The group at the top is of the highest level and the bottom the lowest.
- Color By
Specifies whether to color by a group. 0-n groups can be used as the color-by fields.
- Label By
Specifies whether to show the group name in the innermost rectangle.
- Special Group
Opens the User Defined Group dialog to define how to group information.
- Order/Select N
Opens the Group Options dialog to specify the sort order of the group values and define the number of the group values that will be displayed in the chart.
Property
Lists the summaries used to do size-by/color-by or displayed in the innermost rectangle.
- Size By
Specifies to size by one summary or none.
- Color By
Specifies to color by one summary or none.
- Label By
Specifies whether to show a summary in the innermost rectangle.
Filter
Specifies to filter the data used in the chart. This screen is available only when you create a chart.
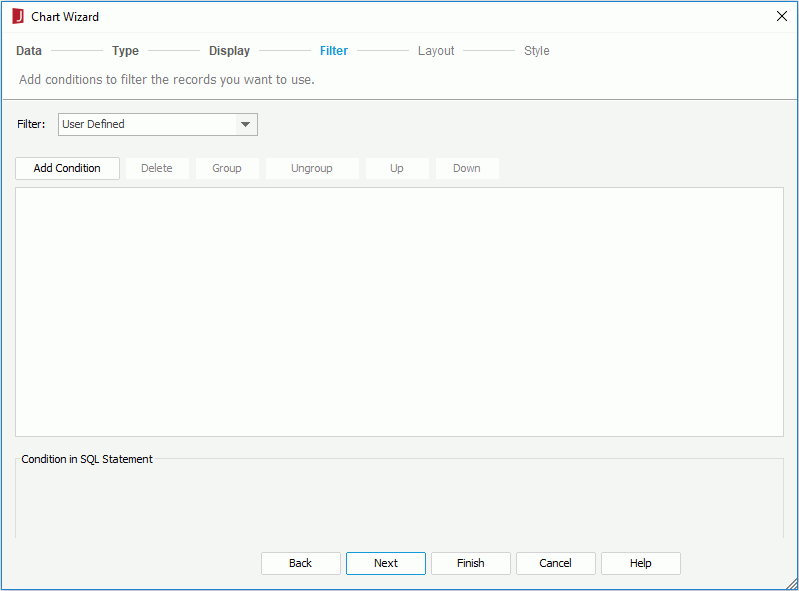
The options in the screen are the same as those in the Edit Filter dialog.
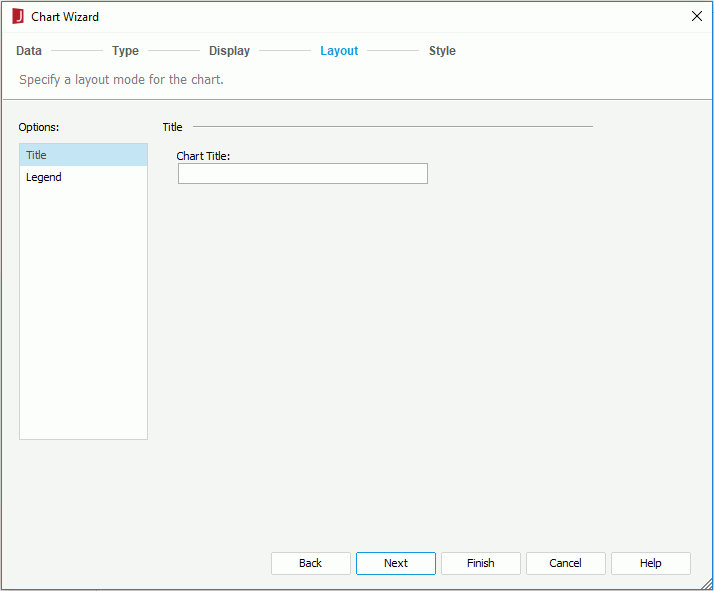
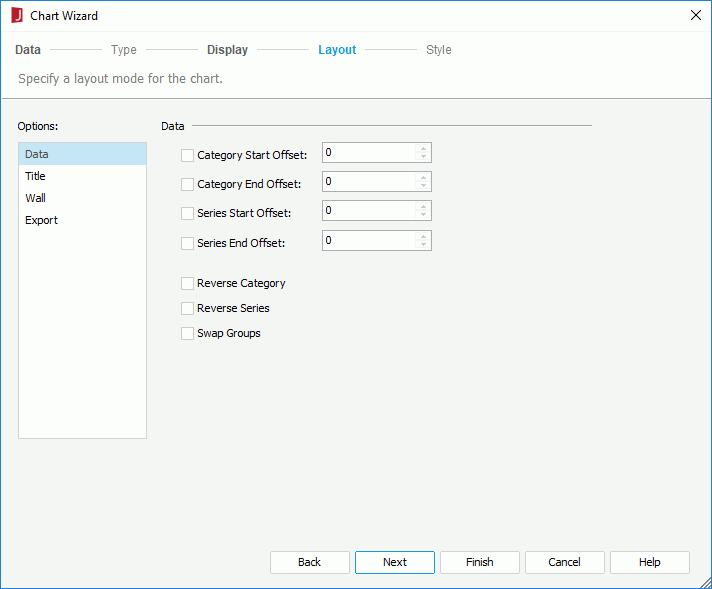
Layout
The Layout screen differs with chart type: common chart types, organization chart, or heat map.
For common chart types
Specifies the layout of the chart elements.
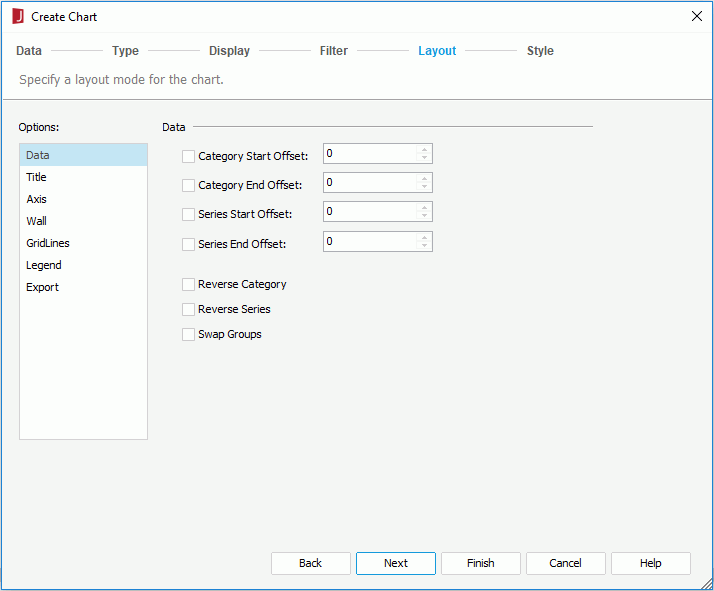
Data
- Category Start Offset
Specifies the start offset of category from which the chart will be displayed.
- Category End Offset
Specifies the end offset of category to which the chart will be displayed.
- Series Start Offset
Specifies the start offset of series from which the chart will be displayed.
- Series End Offset
Specifies the end offset of series to which the chart will be displayed.
- Reverse Category
Specifies whether to reverse the display order of the categories.
- Reverse Series
Specifies whether to reverse the display order of the series.
- Swap Groups
Specifies to display values from different data fields by switching data between the category and series axes, the category and values axes.
Notes:
- If values are set to be less than 0, it means the categories or series will be displayed without any offset.
- If values are set to be greater than 0 and the value of Category/Series Start Offset is greater than that of Category/Series End Offset, all of the categories or series will be displayed.
Title
- Chart Title
Specifies the title of the chart.
- Category (X) Axis Title
Specifies the title of the X-axis.
- Value (Y) Axis Title
Specifies the title of the Y-axis.
- Value (Y2) Axis Title
Specifies the title of the Y2-axis.
Axis
- Show Category (X) Axis
Specifies whether to show the category (X) axis in this chart.
- Show Value (Y) Axis
Specifies whether to show the value (Y) axis in this chart.
- Show Value (Y2) Axis
Specifies whether to show the value (Y2) axis in this chart.
- Show Series (Z) Axis
Specifies whether to show the series (Z) axis in this chart.
Wall
- Show Wall
Specifies whether to show the wall in this chart.
- Show Floor
Specifies whether to show the floor in this chart.
Gridlines
- Show Category (X) Axis Gridlines
Specifies whether to show the gridlines of category (X) axis.
- Show Value (Y) Axis Gridlines
Specifies whether to show the gridlines of value (Y) axis.
- Show Value (Y2) Axis Gridlines
Specifies whether to show the gridlines of value (Y2) axis.
- Show Series (Z) Axis Gridlines
Specifies whether to show the gridlines of series (Z) axis.
Legend
- Show Legend
Specifies whether to show the legend in this chart.
Export
For organization chart
Specifies the layout of the chart elements.
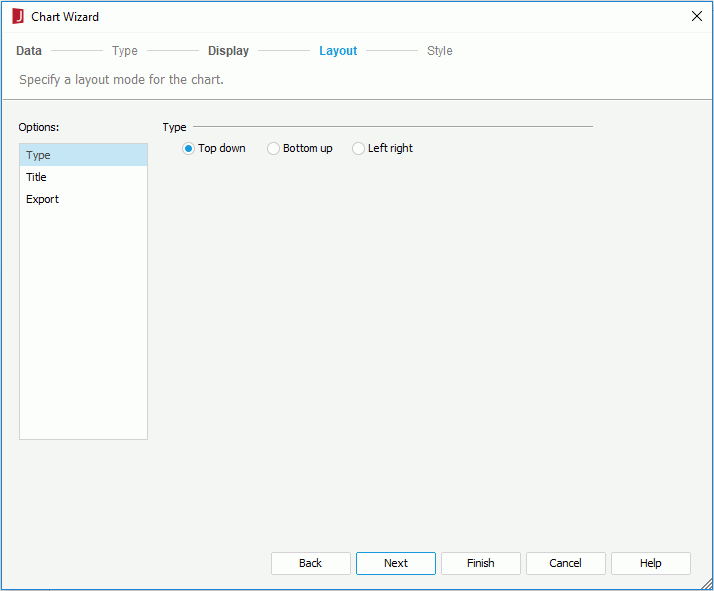
Type
Specifies the layout mode of the organization chart.
- Top down
The organization chart tree expands from top to bottom.
- Bottom up
The organization chart tree expands from bottom to top. It is the reverse of the top down type.
- Left right
The organization chart tree expands from left to right.
Title
- Chart Title
Specifies the title of the chart.
Export
For heat map
Specifies the layout of the chart elements.
Title
- Chart Title
Specifies the title of the chart.
Legend
- Show Legend
Specifies whether to show the legend in this chart.
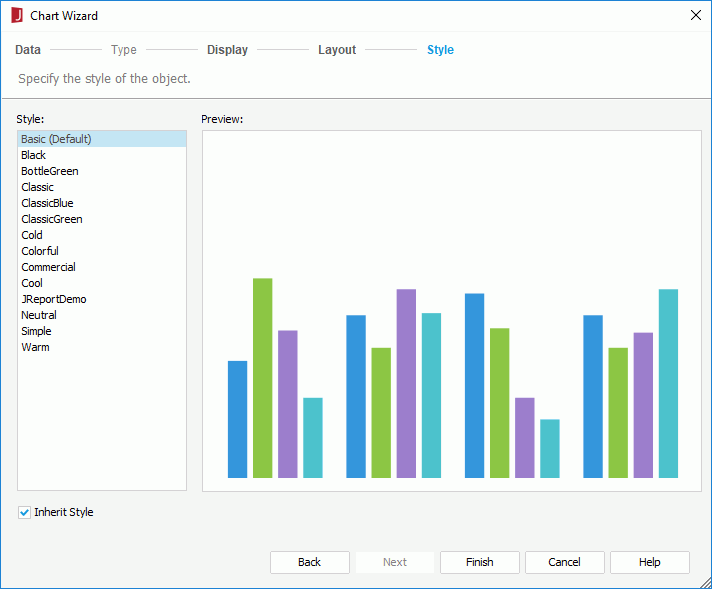
Style
Specifies the style of the chart.
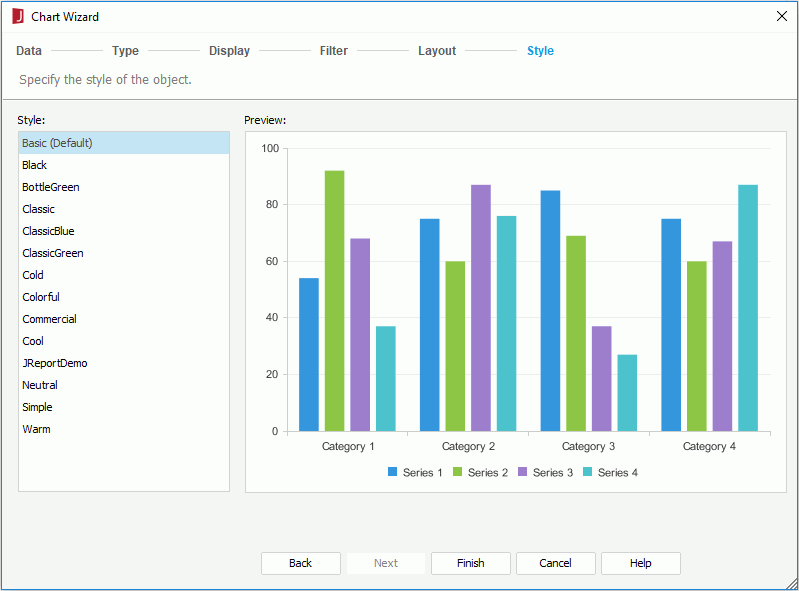
Style
Specifies the style of the chart.
- <Custom>
There is no style information on it and it is only used to support reports built with previous versions which did not bind any style or the bound style cannot be found in the style list.
Preview
Displays a diagram illustrating the effect of the selected style on the chart.
Inherit Style
Specifies whether to make the chart take the style of its parent. This options is available only when the chart is inserted in a banded object in a page report.
Page Setup
Opens the Page Setup dialog to specify page properties. Available only when creating a chart in a page report.
For KPI chart
The wizard appears when you right-click a KPI chart in a KPI component in a web report or library component and select Chart Wizard from the shortcut menu. It helps you to modify a KPI chart and consists of the following screens:
Back
Goes back to the previous screen.
Next
Goes to the next screen.
Finish
Applies the changes to the KPI chart and closes the wizard.
Cancel
Does not retain changes and closes the wizard.
Help
Displays the help document about this feature.
Data
Shows the business view used by the KPI chart.
Type
Specifies the type of the chart. The following 2-D chart types are supported in KPI charts: Bar, Bench, Line, Area, Pie, and Bullet. You can refer to the section Chart Types for the corresponding chart types in detail.
Single chart
Specifies to create a single chart.
- Chart Type
Lists all the chart types that can be used to create a single chart.
- Subtype
Lists all the subtypes of the selected chart type.
Combo chart
Specifies to make more than one type use the primary or secondary axis. The types should be featured as combination charts. Two types of data markers are used to represent different data values.
- Chart Type
Lists all the chart types that can be added as a combo chart.
- Subtype
Lists all the subtypes of the selected chart type.
- Chart Type Groups
Lists all the chart types that are to be used in the combo chart.
- Primary Axis
- <Add Combo Type>
Adds a chart type to the primary axis.
- Secondary Axis
- <Add Combo Type>
Adds a chart type to the secondary axis.
Removes a specified chart type from the Chart Type Groups box.
Display
Specifies the data displayed on the chart.
Title
Specifies the title of the chart.
Resources
Lists all the available data resources in the bound business view. You can also create dynamic formulas and aggregations to use in the chart.
Adds the selected fields to be displayed in the chart.
Removes the selected fields from the chart if they are not required.

Replaces the added field on the right with the selected field in the Resources box.
Category/Series
The box lists the field you want to display on the category/series axis of the chart.
For a real time chart, if no category field is specified, Use System Refresh Time will be automatically displayed in the Category box, namely, the time at which the chart refreshes itself will be used as the category value; the series axis will be disabled.
- Special Group
Opens the User Defined Group dialog to define how to group information.
- Order/Select N
Opens the Category Options dialog or Series Options dialog to specify the sort order of the category or series values and define the number of the category or series values that will be displayed in the chart.
Show Values
Lists the values you want to show in the chart. For a real time chart, the values you add must be of Numeric type and cannot be summary fields.
Opens the Edit Additional Value dialog to edit an additional value. Available only when a constant value or an average value is selected.
Moves the selected value one step up.
Moves the selected value one step down.
Motion Bar for Playable Chart
Lists the field you want to use as the motion field. A motion field can only be of Integer, Date or Time data type. Available to single bar and bench charts in KPI charts only.
- Special Function
Opens the Special Function dialog to define some special function to the motion field. Available only when the motion field is of Date data type.
Real Time
Specifies to run the chart in real time mode, which means it will be updated automatically by using real time data after it is published to JReport Server. Available to single bar, bench, line, and area charts in web reports and library components only.
- Use System Time for Category
Specifies to use the time at which the chart refreshes itself as the category value.
- Refresh Interval
Specifies the time interval at which the chart will get data and refresh itself automatically.
- Show Most Recent N Points
Specifies the number of points that will be kept for the real time data on the chart.
- Incremental Fetch
Opens the Unique Key dialog to configure a unique key for the real time chart.
Layout
Specifies the layout of the chart elements.
Data
- Category Start Offset
Specifies the start offset of category from which the chart will be displayed.
- Category End Offset
Specifies the end offset of category to which the chart will be displayed.
- Series Start Offset
Specifies the start offset of series from which the chart will be displayed.
- Series End Offset
Specifies the end offset of series to which the chart will be displayed.
- Reverse Category
Specifies whether to reverse the display order of the categories.
- Reverse Series
Specifies whether to reverse the display order of the series.
- Swap Groups
Specifies to display values from different data fields by switching data between the category and series axes, the category and values axes.
Notes:
- If values are set to be less than 0, it means the categories or series will be displayed without any offset.
- If values are set to be greater than 0 and the value of Category/Series Start Offset is greater than that of Category/Series End Offset, all of the categories or series will be displayed.
Title
- Chart Title
Specifies the title of the chart.
Wall
- Show Wall
Specifies whether to show the wall in this chart.
Export
Style
Specifies the style of the chart.
Style
Specifies the style of the chart.
Preview
Displays a diagram illustrating the effect of the selected style on the chart.
Inherit Style
Specifies whether to make the chart take the style of the parent KPI component.
Previous Page Next Page