 Previous Page Next Page
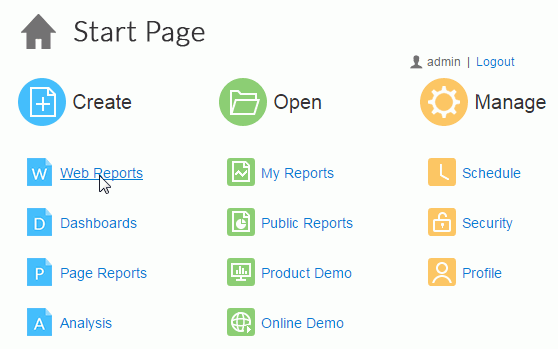
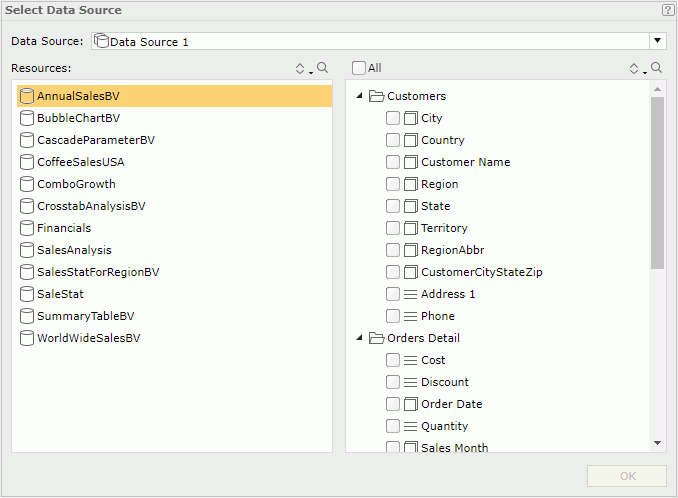
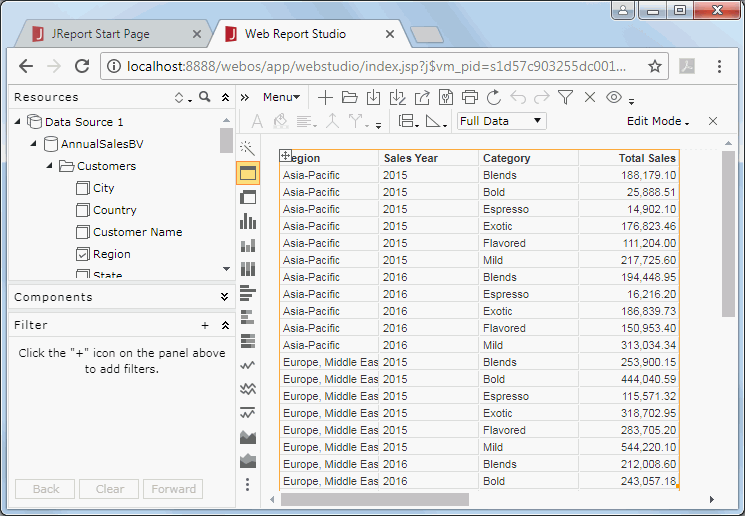
There is a quick start way to create a web report: you need only to select data fields and then JReport generates a table report based on the fields. This saves a lot of time compared to typical report design with the report wizard. After the report is opened in Web Report Studio, you can make use of the visualization toolbar to convert between data components and add more data components easily.


 and
and  to sort and search the required resources.
 , or detail objects
  and group objects
  are selected in the Select Data Source dialog, a table of the Group Above type is created. If detail objects
  and aggregation objects
  are selected, it is the Group Left Above type. When no detail objects
  are added, a Summary Table is created.

You can then manipulate the table and convert the table to crosstab or chart or another table as required. However tables created in the quick start way have some special characteristics:
You can also use URL command to directly create a web report in the quick start way.