 Previous Page Next Page
With the table wizard, it is easy to create tables in a report, however, the wizard varies slightly with different report types: web report/library component, and page report.
A table can be inserted in the report areas listed in Component placement.
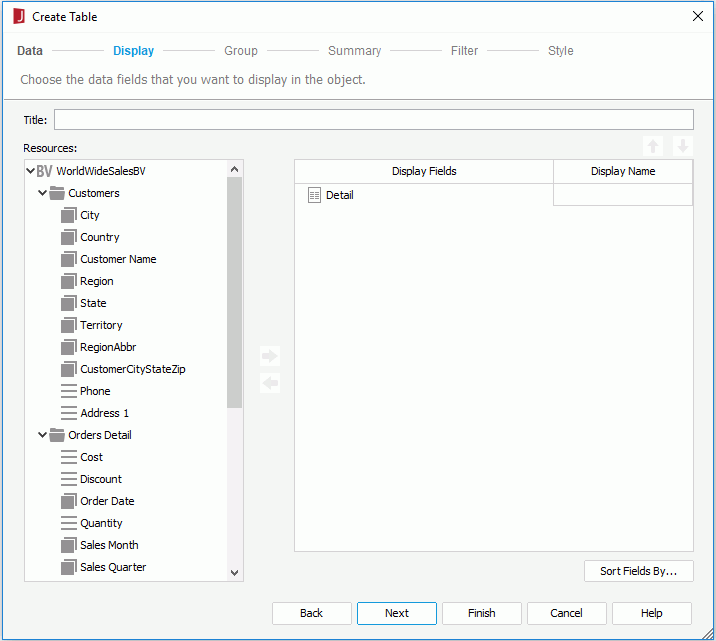
To define the data for a group left, group above, or group left above table:
 or drag and drop it to the display field box on the right. If a field is not required, select it and click
  or drag and drop it to the Resources box. Click
  or
or  to adjust the order of the fields. If required, modify the display name of any added field by clicking its Display Name text box. You can also click the Sort Fields By button to specify how to sort data in the table.
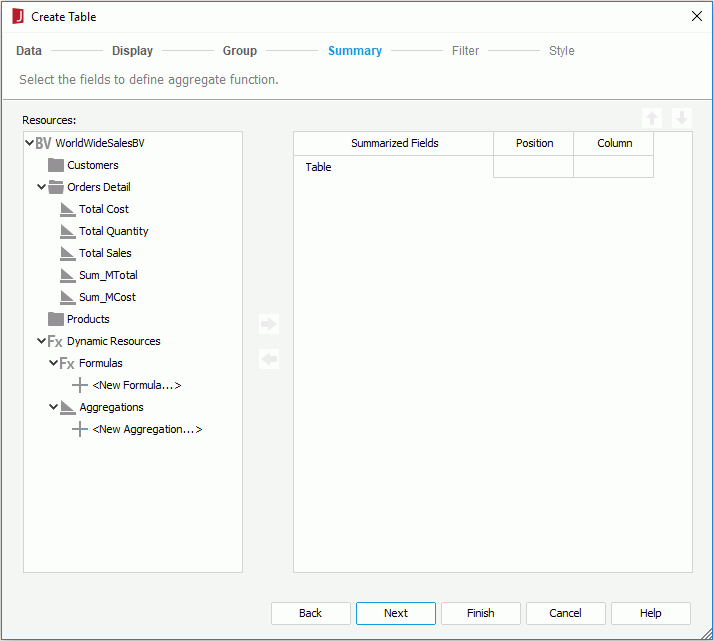
 or drag and drop it to the right box, then specify where to place the aggregation in the table from the Position and Column columns. You can add several aggregations for any group level. If an aggregation is not required, select it and click
  or drag and drop it to the Resources box. Click
  or
or  to adjust the order of the aggregations in the current group or move an aggregation to another group if needed.
The Position and Column columns work together to show the positions of the aggregations. When an aggregation is added right below the Table node, the aggregation and its label will be placed in the intersection of the table footer
panel and the first two detail columns.
When an
aggregation is added below a specific group node, the aggregation and its label will be placed in the intersection of the group footer panel and the first two detail columns.
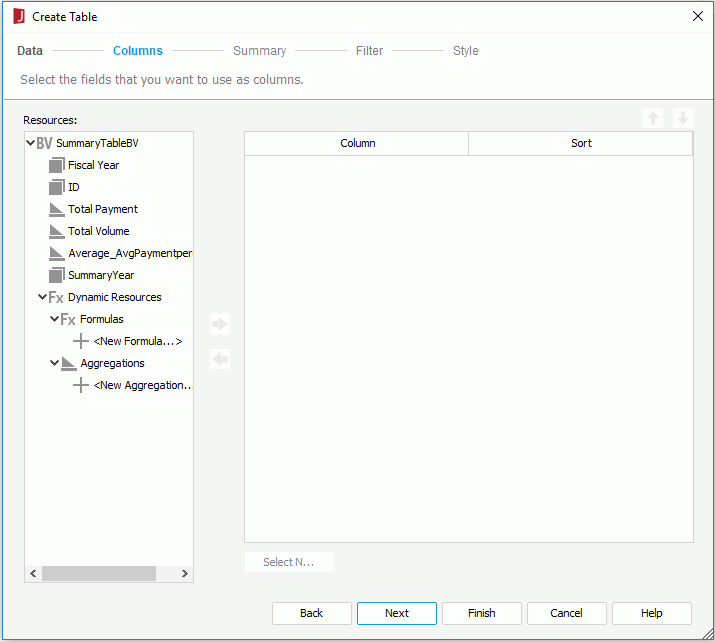
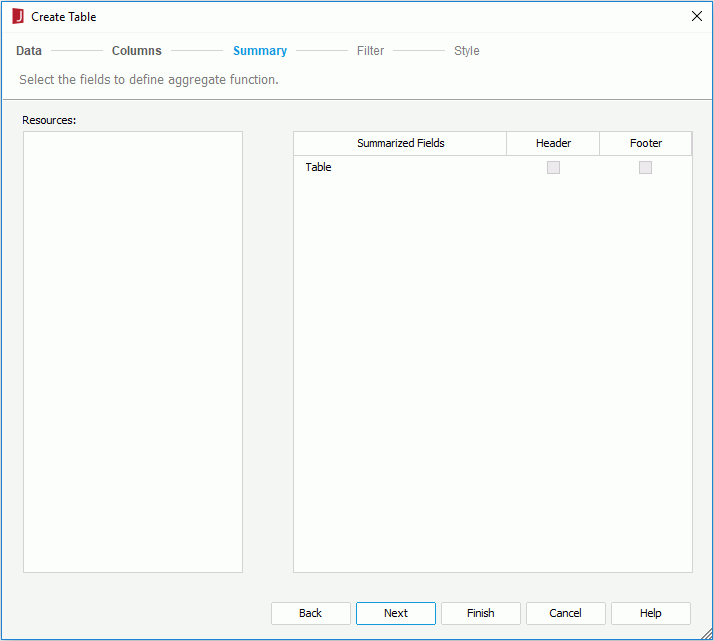
To define the data for a summary table:
 or drag and drop it to the column box on the right. You can add only one object at a time. If an object is not required, select it and click
  or drag and drop it to the Resources box. Click
  or
or  to adjust the display order of the objects. The table will be automatically grouped by the added group objects and the position of the group objects in the right box determines the group level: the topmost group object the highest group level and the lowest group object the innermost group level. All the aggregation objects are parallel and calculate based on the innermost group. For a group, you can specify its sorting manner and define the Select N condition to show data of certain range in the group.
If you have used the menu tab command to insert the table and specified to insert it to position other than the report body or tabular cell, after clicking Finish in the wizard, you need to click the mouse button in the destination once again in order to insert the table there.
A page report can be created either based on query resources or business views, which is determined at the time when the page report is created by the Create Using Business View option. Once defined, all the data components in the page report can only be created on the specified data resource type. The procedure for creating a table in a page report varies with the data resource type specified for the page report: query resource or business view.
To insert a table in a page report that is based on query resources:
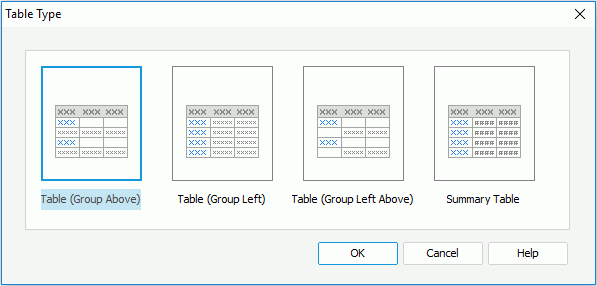
The Create Table wizard appears.
If you want to use an existing dataset in the current page report to create the table, click the More Options button and then:
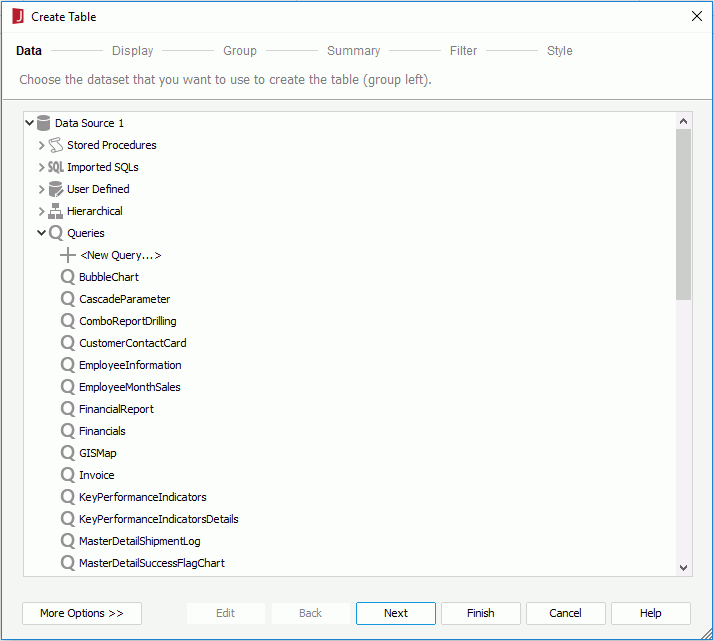
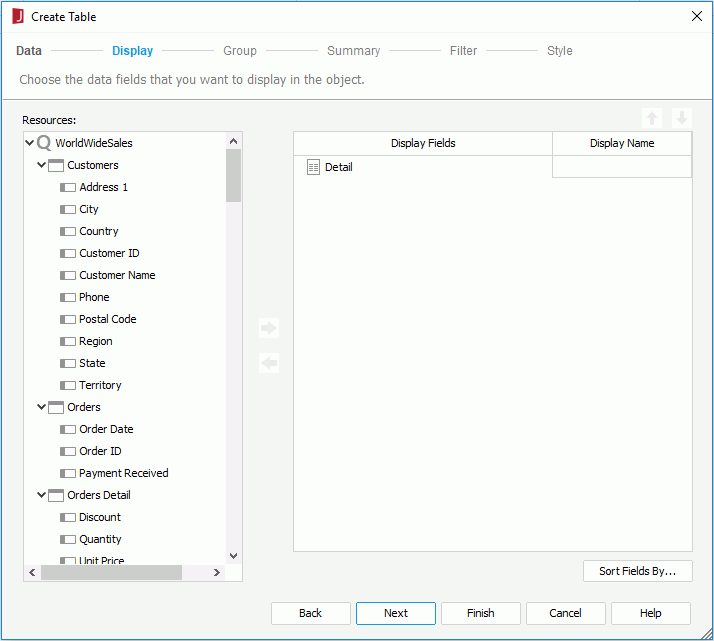
 or drag and drop it from the Resources box to the display field box on the right. If a field is not required, select it and click
  or drag and drop it to the Resources box. Click
  or
or  to adjust the order of the fields. If required, modify the display name of any added field by clicking its Display Name text box. You can also click the Sort Fields By button to specify how to sort data in the table.
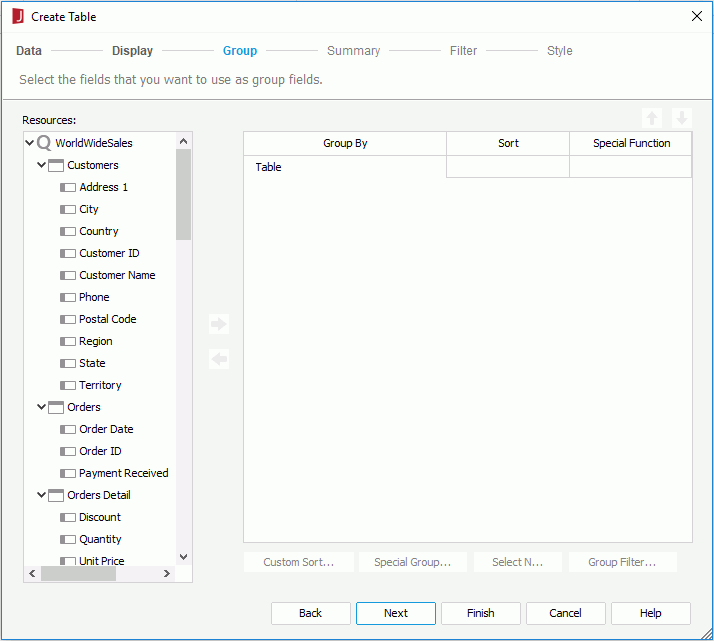
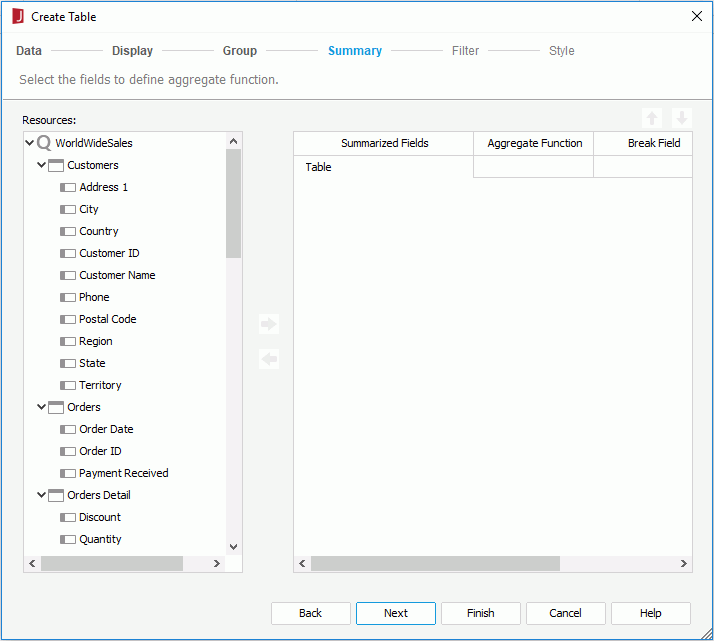
 or drag and drop it to the right box, then specify the aggregate function as required. You can add several summaries for any group level. JReport will automatically give the summaries proper name labels to help you clarify the meaning of the numbers. If a summary is not required, select it and click
  or drag and drop it to the Resources box. Click
  or
or  to adjust the order of the summaries in the current group or move a summary to another group if needed.
The Position and Column columns work together to decide the positions of the summaries and they are editable for a summary table. When a summary is added right below the Table node, specify whether to place it in the table footer or header panel from the Position drop-down list and whether to place it in the detail column or a new summary column from the Column drop-down list.
The summaries created from the Summary screen will be added to the current catalog data source as static summaries even when identical summaries already exist. Therefore, it is better not to create summaries here, instead you can add dynamic summaries to the catalog and drag and drop the dynamic summaries into the table after it is created.
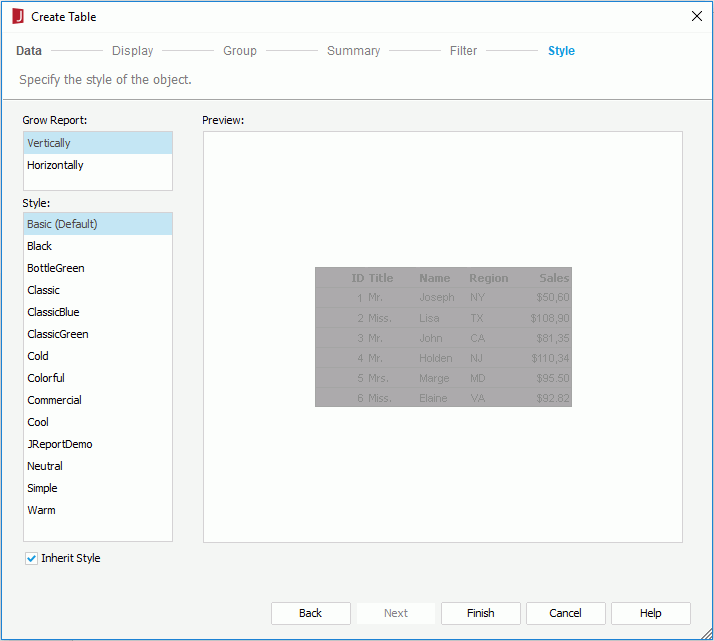
When you have specified to insert the table into a banded object, by default the table will inherit its parent's style. If you want to apply another style to the table, uncheck the Inherit Style option and then select the required style from the Style box. For more information, see Inheriting Styles.
If you have used the menu tab command to insert the table and specified to insert it to position other than the report body or tabular cell, after clicking Finish in the wizard, you need to click the mouse button in the destination once again in order to insert the table there.
When the table is inserted into a banded object, you can set up data container link between the table and its parent.
To insert a table in a page report that is based on business views:
The Create Table wizard appears.
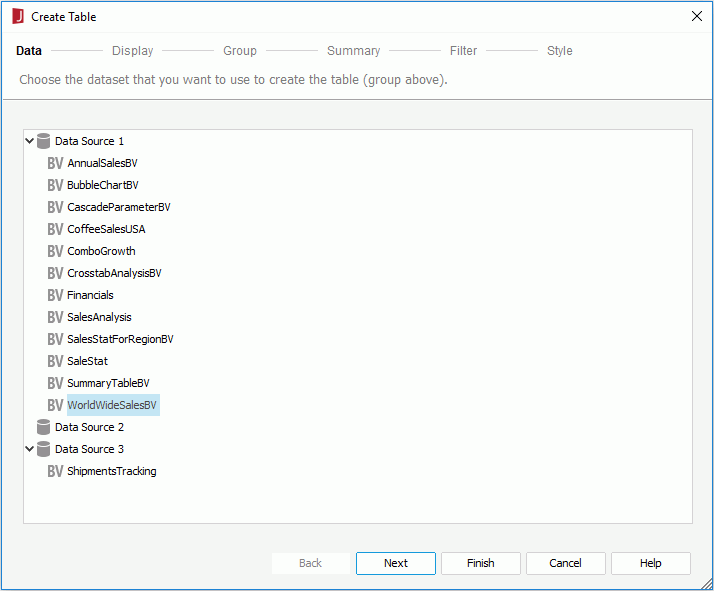
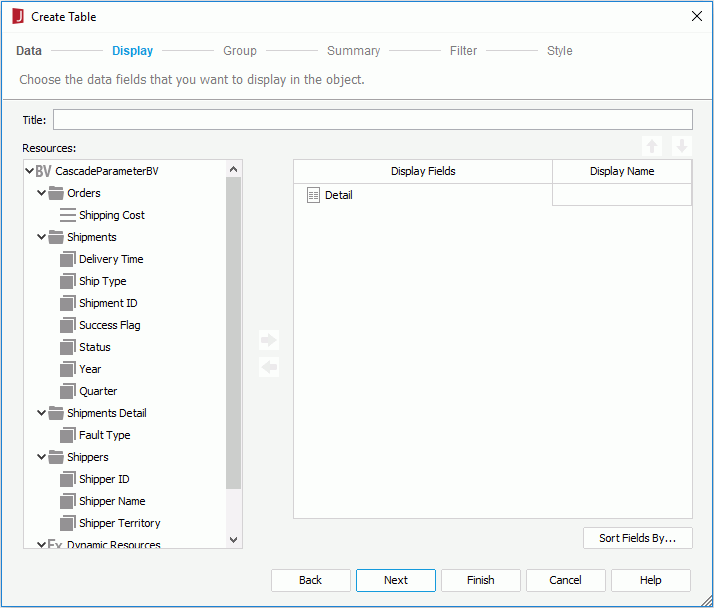
 or drag and drop it from the Resources box to the display field box on the right. If a field is not required, select it and click
  or drag and drop it to the Resources box. Click
  or
or  to adjust the order of the fields. If required, modify the display name of any added field by clicking its Display Name text box. You can also click the Sort Fields By button to specify how to sort data in the table.
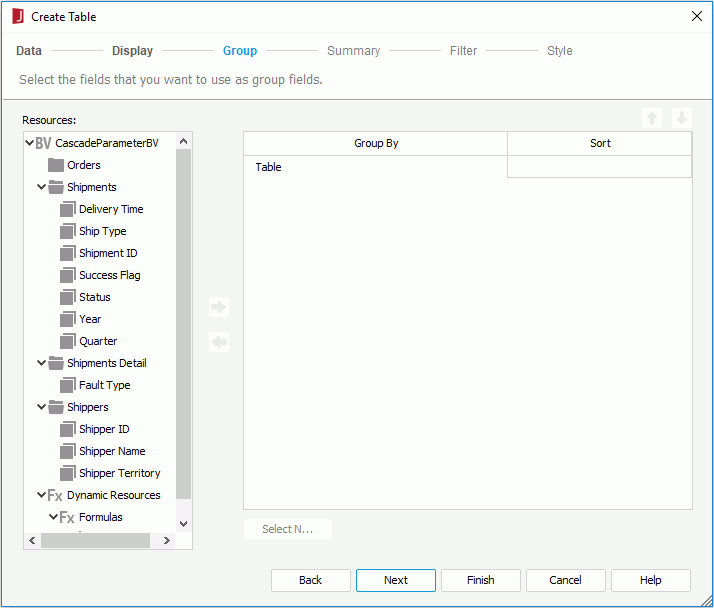
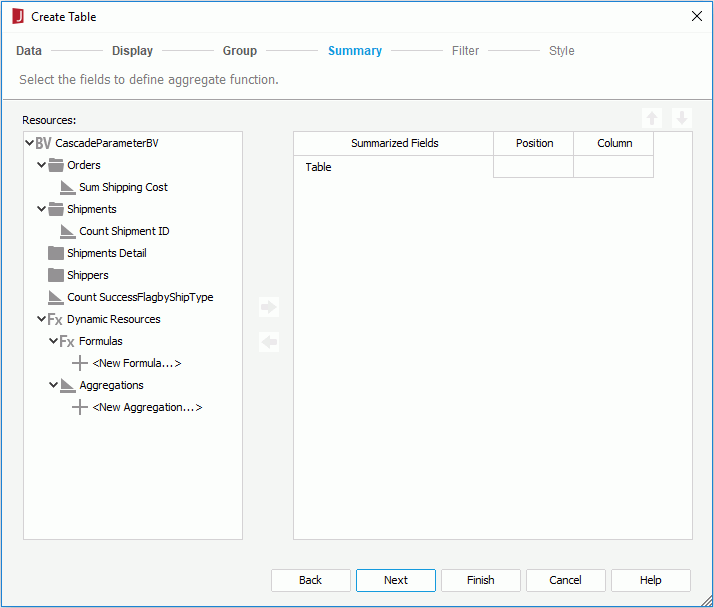
 or drag and drop it to the right box. You can add several aggregations for any group level. JReport will automatically give the aggregations proper name labels to help you clarify the meaning of the numbers. If an aggregation is not required, select it and click
  or drag and drop it to the Resources box. Click
  or
or  to adjust the order of the aggregations in the current group or move an aggregation to another level if needed.
The Position and Column columns work together to decide the positions of the aggregations and they are editable for a summary table. When an aggregation is added right below the Table node, specify whether to place it in the table footer or header panel from the Position drop-down list and whether to place it in the detail column or a new summary column from the Column drop-down list.
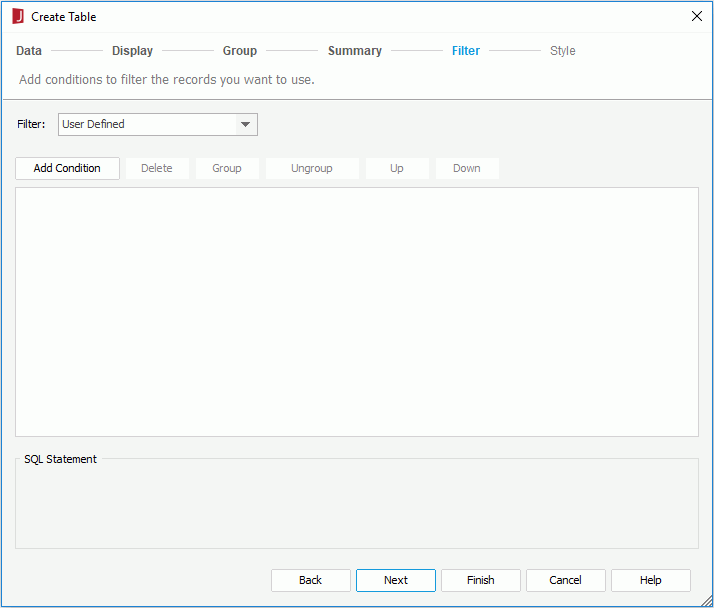
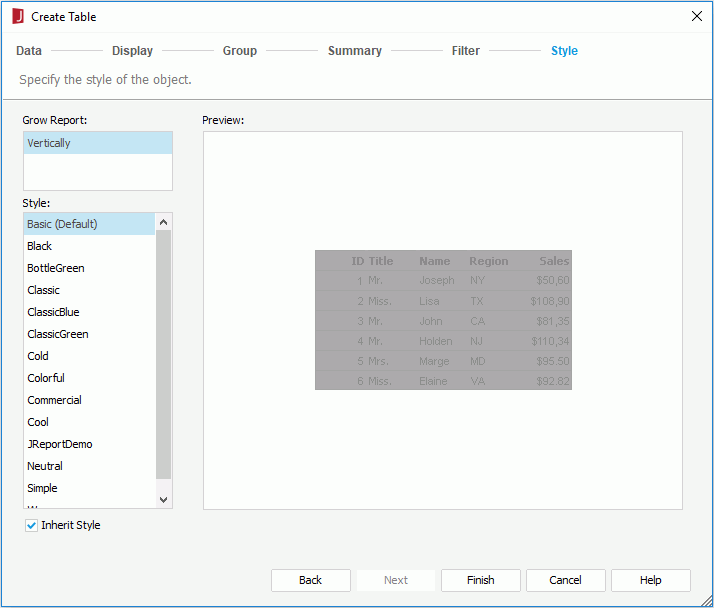
When you have specified to insert the table into a banded object, by default the table will inherit its parent's style. If you want to apply another style to the table, uncheck the Inherit Style option and then select the required style from the Style box. For more information, see Inheriting Styles.
If you have used the menu tab command to insert the table and specified to insert it to position other than the report body or tabular cell, after clicking Finish in the wizard, you need to click the mouse button in the destination once again in order to insert the table there.
Notes:
See also:
<install_root>\Demo\Reports\SampleComponents\TableReport.cls.