 Previous Page Next Page
You can insert a banded object into a page report either with the wizard or by dragging and dropping. With the banded object wizard, it is easy to create banded objects, however, the wizard varies with the data resource type used to create the banded object: query resource or business view.
The data resource type a page report can use is determined at the time when the page report is created by the Create Using Business View option. Once defined, all the data components in the page report can only be created on the specified data resource type.
A banded object can be inserted in the report areas listed in Component placement.
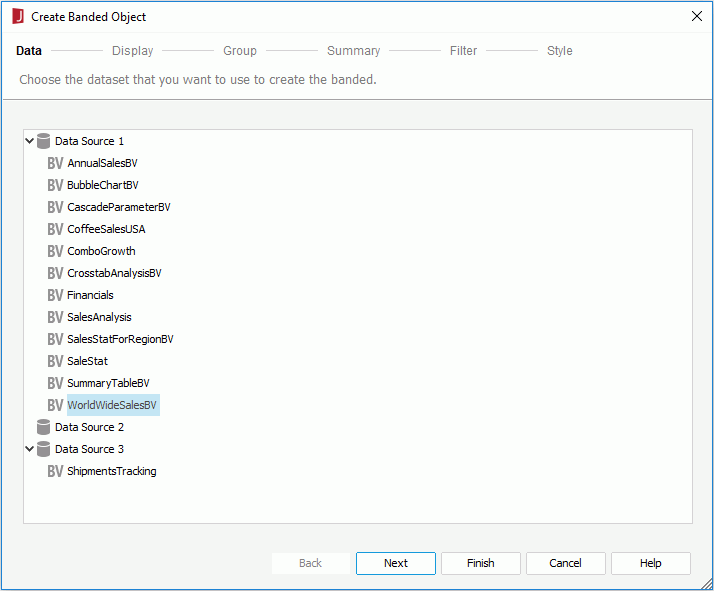
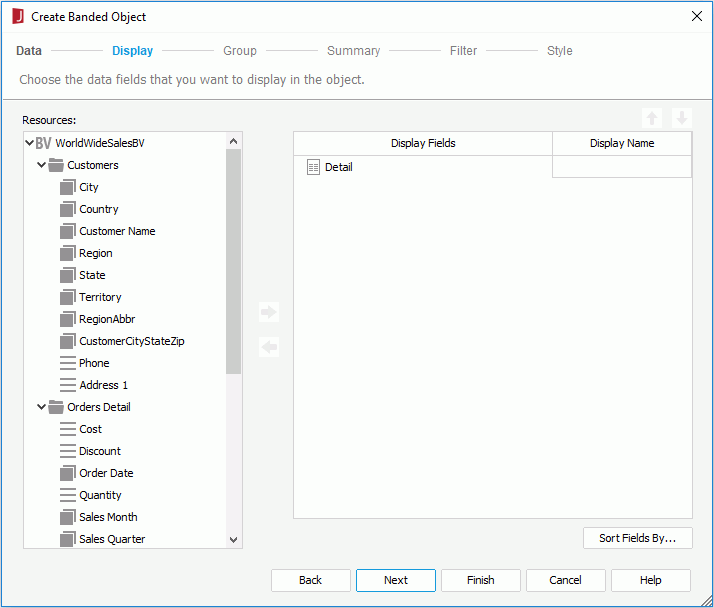
 or drag and drop it from the Resources box to the display field box on the right. If a field is not required, select it and click
  or drag and drop it to the Resources box. Click
  or
or  to adjust the order of the fields. If required, modify the display name of any fields by clicking its Display Name text box. You can also click the Sort Fields By button to specify the field on which the sorting will be based and the sorting manner as required (for details, refer to Sorting the Data).
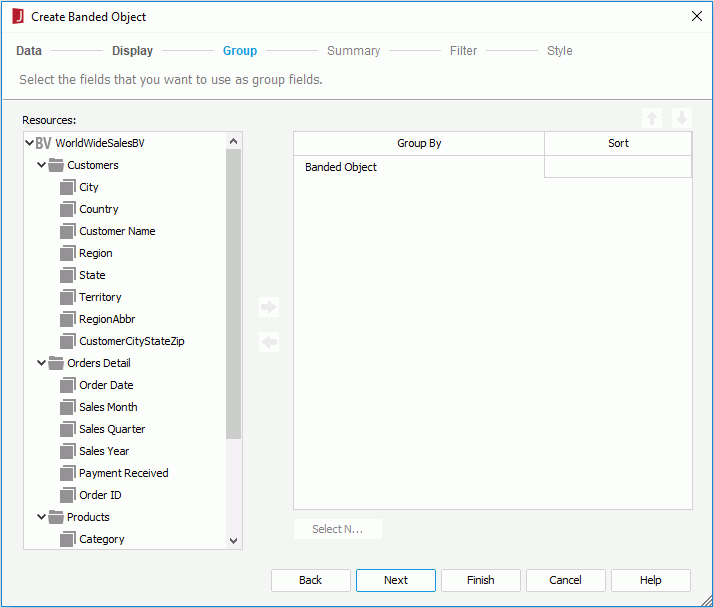
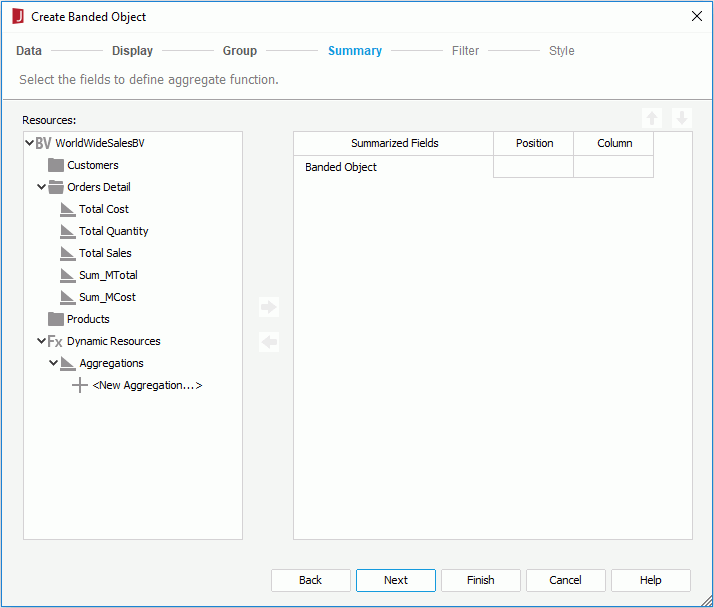
 or drag and drop it to the right box. You can add several aggregations for any group level. If an aggregation is not required, select it and click
  or drag and drop it to the Resources box. Click
  or
or  to adjust the order of the aggregations in the current group or move an aggregation to another group if needed.
The Position and Column columns work together to show the positions of the aggregations. When an aggregation is added right below the Banded Object node, the aggregation and its label will be placed in the intersection of the banded footer
panel and the first two detail columns.
When an
aggregation is added below a specific group node, the aggregation and its label will be placed in the intersection of the group footer panel and the first two detail columns.
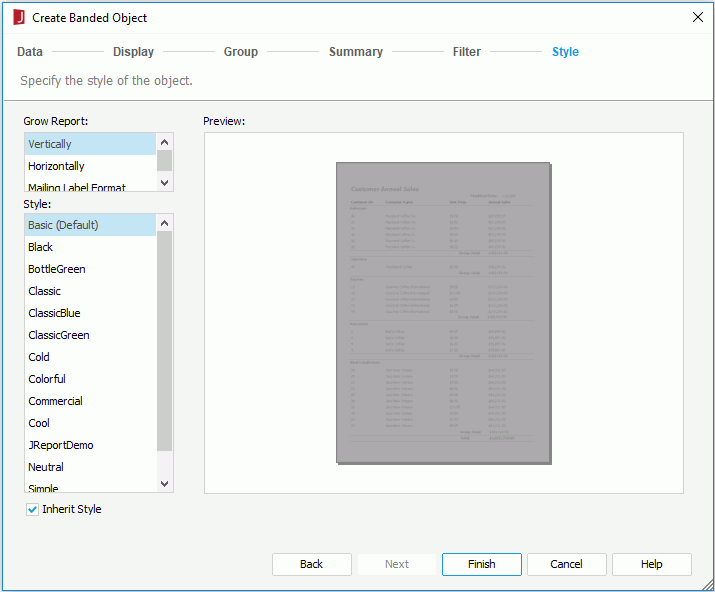
If you have specified to insert the banded object into another banded object, by default the banded object will inherit its parent's style. If you want to apply another style to the banded object, uncheck the Inherit Style option and then select the required style from the Style box. For more information, see Inheriting Styles.
If you have specified to insert the banded object in the report body or tabular cell, the banded object will be inserted there upon clicking the Finish button; otherwise, click the mouse button in the location to insert the banded object.
Besides using the wizard, you can also drag a blank banded object to the report. To do this:
 to a destination in the report which allows the insertion of a banded object. A blank banded object is then created.
If you want to use an existing dataset in the current report to create the banded object, click the More Options button and then:
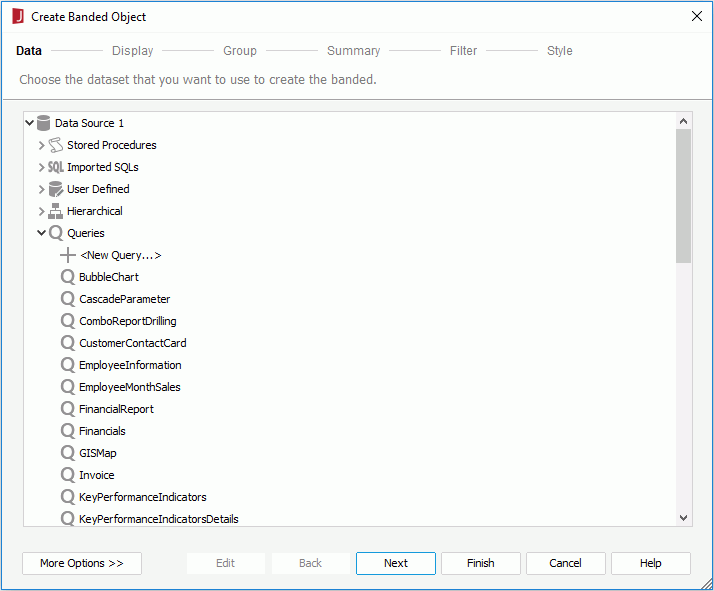
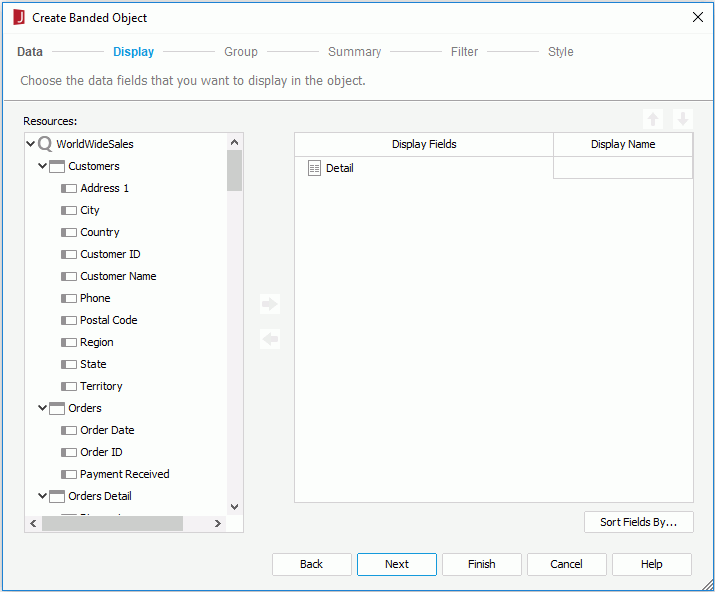
 or drag and drop it from the Resources box to the display field box on the right. If a field is not required, select it and click
  or drag and drop it to the Resources box. Click
  or
or  to adjust the order of the fields. If required, modify the display name of any added field by clicking its Display Name text box. You can also click the Sort Fields By button to specify the fields on which the sorting will be based and the sorting manner as required (for details, refer to Sorting the Data).
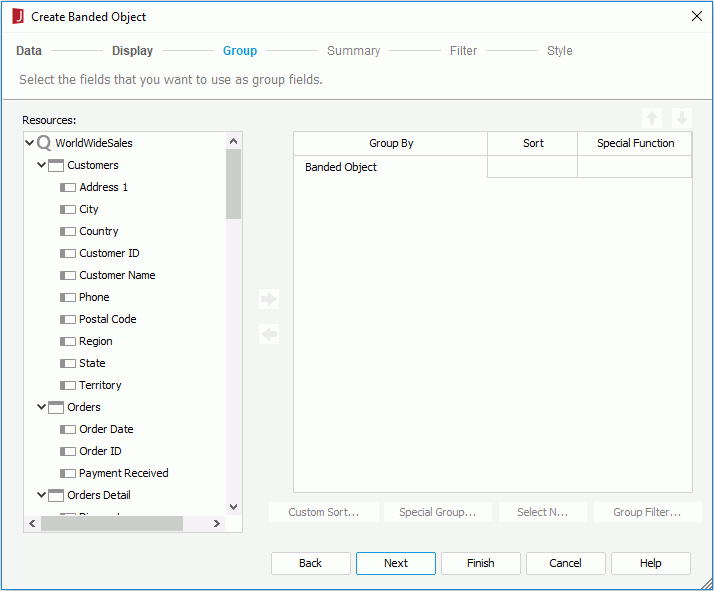
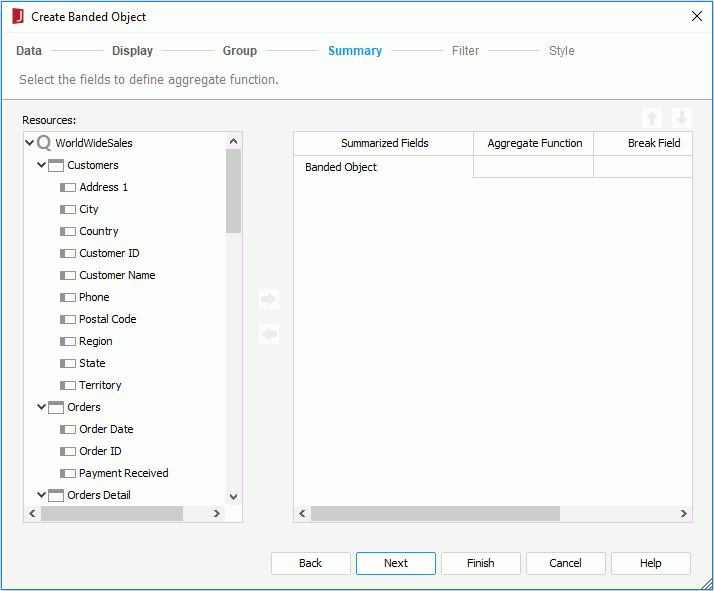
 or drag and drop it to the right box, then specify the aggregate function as required. You can add several summaries for any group level. JReport will automatically give the summaries proper name labels to help you clarify the meaning of the numbers. If a summary is not required, select it and click
  or drag and drop it to the Resources box. Click
  or
or  to adjust the order of the summaries in the current group or move a summary to another group if needed.
The Position and Column columns work together to decide the positions of the summaries. When a summary is added right below the Banded Object node, specify whether to place it in the banded footer or header panel from the Position drop-down list and whether to place it in the detail column or a new summary column from the Column drop-down list.
The summaries created from the Summary screen will be added to the current catalog data source as static summaries even when identical summaries already exist. Therefore, it is better not to create summaries here, instead you can add dynamic summaries to the catalog and drag and drop the dynamic summaries into the banded object after it is created.
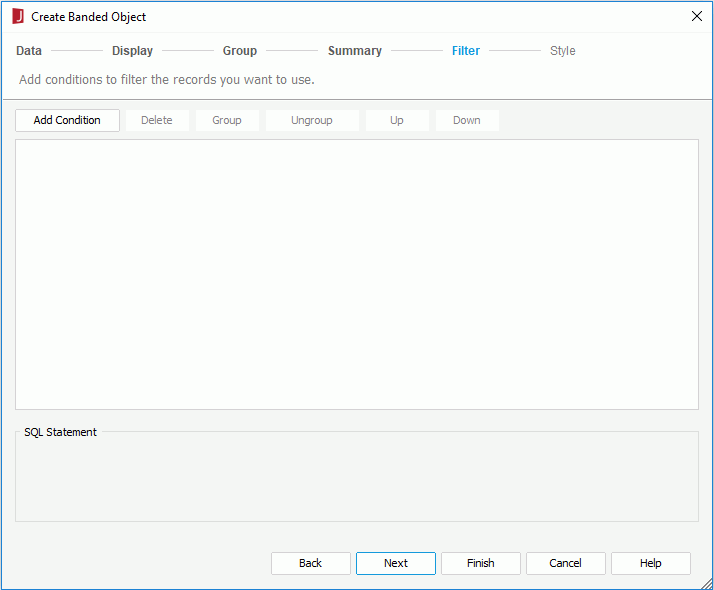

If you have specified to insert the banded object into another banded object, by default the banded object will inherit its parent's style. If you want to apply another style to the banded object, uncheck the Inherit Style option and then select the required style from the Style box. For more information, see Inheriting Styles.
If you have specified to insert the banded object in the report body or tabular cell, the banded object will be inserted there upon clicking the Finish button; otherwise, click the mouse button in the location to insert the banded object.
Besides using the wizard, you can also drag a blank banded object to the report. To do this:
 to a destination in the report which allows the insertion of a banded object. A blank banded object is then created.
When a banded object is inserted into another banded object, you can set up data container link between the banded object and its parent.
Notes:
See also:
<install_root>\Demo\Reports\SampleComponents\BandedObjectReport.cls.