 Previous Page Next Page
Tuning Server Performance
Preloading catalogs and reports
Customizing the heartbeat interval
Using the Action Task Manager
Configuring table pipeline
Many variables affect the performance of JReport Server, for example, the hardware and software environment that it runs in. You may or may not have any influence in this regard, but you are able to carry out performance tuning to make JReport Server efficient, reliable, and fast.
The following lists the factors that help with the server performance:
- Use Connection Pooling either by using JNDI and the connection pool of the application server or JReport connection pooling using ConnectionPoolConfig.properties.
- For each of your business views set Prefetch=false in JReport Designer so that only the fields used in the report are fetched from the DBMS. The default is true so if you have a large business view with many fields yet only a few are used in each report a lot of resources of memory and network band width will be used fetching data which is not needed in the report.
- For best performance and reliability you should change the JReport Server DBMS from Derby (the internal Java DBMS) to your standard production DBMS or other DBMS you are familiar with. Derby is included for out of the box ease of use but is not recommended for production use.
- Limiting the number of actively running reports can avoid momentary system overload. Setting the property performance.max.reports to a limited number in server.properties in the
<install_root>\bin directory can smooth out performance and provide higher overall throughput. The best number depends entirely on your environment so needs to be configured after testing which setting provides the highest throughput in your environment. A good starting point is the number of CPUs plus 2. For example, if you have a quad-core CPU start out with the value set to 6.
- When using an application server, you can achieve a similar result to performance.max.reports by limiting the total number of active threads for JReport. You can assume a report consumes around 5 threads on average so setting the number of active threads to 50 is similar to setting performance.max.reports=10 but may provide better overall throughput since it is has finer granularity to control CPU utilization.
- Cache catalogs, reports and images. This is effective when the same catalogs, templates and images are used frequently but may harm performance when many different catalogs, templates and images are used and the requested resource is not in the cache. In this case, it slows performance checking the cache and wastes memory.
- Preload catalogs and reports. This will improve the performance the first time the report or catalog is used.
- Set log level to record less information. In production servers log level should be ERROR unless you are searching for specific issues such as monitoring the SQL statements sent to the DBMS.
- Convert reports from earlier versions into current version.
- Set task-level timeout for advanced run and scheduled tasks. This will ensure that users do not run extremely long jobs accidentally.
- Modify the JVM heap size. Again this needs some testing on your system to determine the best overall throughput. On 32-bit systems the maximum size is 2GB; however, on 64-bit systems the maximum size is extremely large. The heap usage can be monitored by tools such as the JDK jconsole application. Set a starting heap size just under your normal average usage (use -Xms in JRServer.sh/bat) and set the maximum heap (use -Xmx) to the maximum that you want the heap to grow. JReport can use additional heap to improve performance of queries and sorting and reducing the number of garbage collections (GC) which use CPU time. However, using too much memory for Java heap can impact performance of other applications. The maximum heap size is 1.4G by default.
- Set queue.policy=1, 2 or 3 in server.properties in the
<install_root>\bin directory to turn on using priorities so on demand reports will be higher than scheduled reports. By using the different policies, you can dynamically adjust priorities so reports increase their priority the longer they wait in the queue. A third high priority queue can also be enabled for on demand reports which need to run immediately.
- Set engine.single_thread=true or false in server.properties. Depending on your environment and JDK, some systems run faster with a single threaded engine than with a multi-threaded engine. This needs to be tested in your environment to determine which setting provides the highest throughput. As a general rule smaller systems are faster with this set to true and larger systems are faster with it set to false.
- Set the maximum number of user handlers to the optimal size by setting the httpserver.max.handlers property in the server.properties file. This is the number of threads which are waiting to handle user requests. Setting this larger than needed wastes resources; however, setting it too small will mean that some users will not be able to access reporting until someone else exits.
- Adjust the engine's utilization of the CPU in accordance with your own requirements, by setting the Engine Priority property to a higher or lower priority on the JReport Administration > Configuration > Advanced page.
- Select the two options View Incomplete Pages and Format Page on Demand in the Profile > Customize Profile > Page Report Studio > Properties > Advanced tab for faster viewing of the first page of large reports in Page Report Studio. The disadvantage is that to see the actual number of pages, calculate complete report totals and create the TOC, the user has to manually select the last page of the report.
- Be sure performance.exe_gc=false as the default in the server.properties file. This allows the JDK to schedule garbage collections as needed rather than at specific times.
- To take less overhead for the JReport Server DBMS updates you can set Performance.commit.thread=true and Performance.commit.interval=30 so that commits of updates to the DBMS will be every 30 seconds rather than ever write.
- If you have a very active server it is more efficient to set resource.result.life to 600 so that the temporary files are removed every 10 minutes rather than once per hour.
- Minimize the usage of Word Wrap to columns which really require it. Word Wrap requires that we pre-format the data in memory to determine its size then wrap the field as necessary then continue to format it. If fields never are large enough to wrap, especially objects like labels, it is a lot of overhead.
- True Type Fonts (TTF) provide better throughput by reducing font substitution and scaling time. Changing all the fonts to use TTF fonts improves the quality of the output as well as the performance when a mixture of operating system is used such as report design on Windows and production on Unix.
- Use binary versions of .cls and .cat, not the xml versions when you publish reports to JReport Server. This saves processing time and I/O time when converting the files to Java classes.
- The Quartz scheduler by default checks every 15 seconds (15000ms) to see if there are any scheduled reports that need to be started. This requires queries to the DBMS to check the schedule times. By editing quartz.properties in
<install_root>\bin you can increase the time by updating org.quartz.scheduler.idleWaitTIme in milliseconds to the frequency you need. You can also adjust org.quartz.threadPool.threadCount to limit the number of threads starting scheduled reports. The default is 5.
- Customize the heartbeat interval for web browser products such as Web Report Studio, Page Report Studio, JDashboard, and Visual Analysis.
- Some Page Report Studio operations require a large amount of memory and CPU processing power. The Action Task Manager improves Page Report Studio service performance by preventing a large number of actions from being run simultaneously.
- Use table pipeline to speed up the rendering performance of tables involving millions of data records in Web Report Studio and JDashboard.
Preloading catalogs and reports
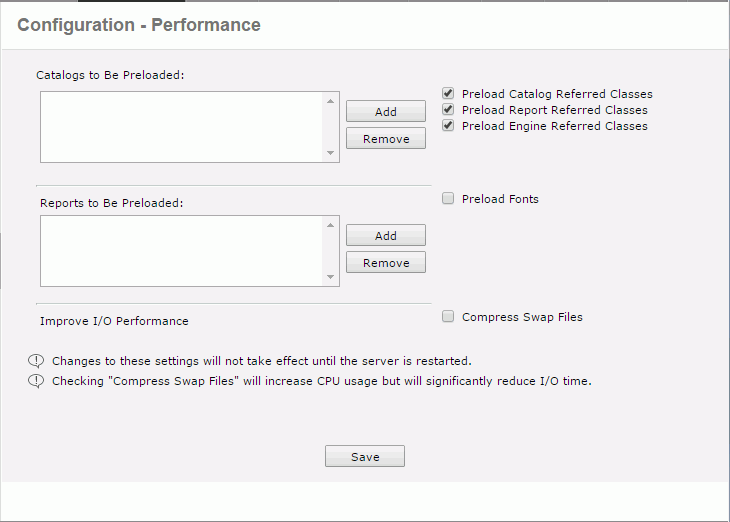
Catalogs, reports, analysis templates, as well as Java classes and fonts can be preloaded when JReport Server is started so as to improve performance.
- On the JReport Administration page, click Configuration on the system toolbar and select Performance from the drop-down menu. The Configuration - Performance page is displayed.

- Click the Add button beside the Catalogs to Be Preloaded box.
- In the displayed dialog, click the Browse button to select the folder or type in the folder name with full path in the server resource tree directly, for example,
/SampleReports. The catalogs in the folder will be loaded. Select a catalog and its version from the corresponding drop-down list and then click OK. The catalog will be added in the Catalogs to Be Preloaded box.
- Repeat the above step to add more catalogs to the Catalogs to Be Preloaded box. To remove an unwanted catalog from the box, select it and click Remove.
- Click the Add button beside the Reports to Be Preloaded box.
- In the displayed dialog, click the Browse button to select the folder or type in the folder name with full path in the server resource tree directly, for example,
/SampleReports. The reports and analysis templates in the folder will be loaded. Select a report or analysis template and its version from the corresponding drop-down list and then click OK. The report or analysis template will be added in the Reports to Be Preloaded box.
- Repeat the above step to add more reports and analysis templates to the Reports to Be Preloaded box. To remove an unwanted report or analysis template from the box, select it and click Remove.
- To preload Java classes that are used by catalogs, reports and the JReport Engine, select the corresponding checkboxes. Preloading some useful Java classes will improve performance. Otherwise, it will take some time for JReport Server to load any required Java classes when generating reports. The feature is not available to organization admin.
- To preload the fonts used by reports, check the Preload Fonts checkbox. The option is not available to organization admin.
- To compress the temporary data generated during runtime before it is swapped to disk, select the Compress Swap Files checkbox. By compressing the swap files, the I/O efforts in certain circumstance may be remarkably reduced so that the overall performance can be improved. This function is not available to organization admin.
Note: Compressing swap files will increase CPU pressure because it uses compress algorithm to shrink data, so if your system already has high CPU usage, enabling this option will bring extra performance impact, depending on different circumstance, and such impact may overcome the performance gain that comes from reducing I/O time.
- Click Save and then restart JReport Server to make the settings to take effect.
Customizing the heartbeat interval
The heartbeat mechanism is introduced in Web Report Studio, Page Report Studio, JDashboard, and Visual Analysis. It works together with user session timeout to release the unused resources of the products in time. Heartbeat is activated by default. It begins to work after any of the products are opened, by reporting to JReport Server that the product is alive per a period of time in a way similar to heartbeats. If within 3 times of the heartbeat interval JReport Server has not received a heartbeat, the product will be expired and the resources be released. Heartbeat stops in the following situations:
- The product or the related web browser is closed.
- The computer is powered off.
- Though the product is open, there are not any actions happening to the product such as mouse move and automatic refresh until the session times out.
If the heartbeat interval is shorter than the user session timeout time which can be configured by the administrator on the JReport Server Administration page > Configuration > Advanced page, the session will not expire as long as there are heartbeats. If the heartbeat interval is longer than the session timeout time, the session will be expired when the session times out.
The following parameters are used for heartbeat:
- jrd.heartbeat
The heartbeat interval in milliseconds. The default value is 15000 milliseconds.
- jrd.hbtimeout
The period of time before heartbeat times out in milliseconds. The default value is three times of the heartbeat interval.
Heartbeat can be configured by adding the JVM parameter -Djrd.heartbeat and -Djrd.hbtimeout in the JReport Server startup file. In an integration environment, you can also specify the parameters in web.xml:
<context-param>

  <param-name>jrd.heartbeat</param-name>

  <param-value>15000</param-value>

  </context-param>

  <context-param>

  <param-name>jrd.hbtimeout</param-name>

  <param-value>45000</param-value>

  </context-param>
Heartbeat uses Web Worker technology of HTML5. Web Worker is supported by Firefox, Chrome, Safari and IE10 where it is working in a separate javascript thread. But in IE9, IE8 JReport can only simulate Web Worker using iFrame, which means that the heartbeat code can be blocked by render code in IE 9 browsers.
Using the Action Task Manager
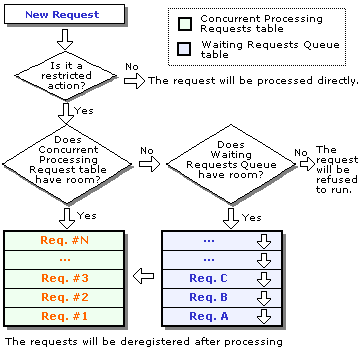
The Action Task Manager coordinates Page Report Studio actions through two fixed-size tables:
- Concurrent Processing Table - This registers the requests that are currently being processed by the Page Report Studio service.
- Waiting Requests Queue - This registers the requests that are waiting for being processed by the Page Report Studio service.
Note: Only certain operations that consume considerable hardware resources need to be prevented from being run at the same time. You can define which kind of requests need to be queued before being processed.

When a new Page Report Studio request reaches the server, it will be processed according to the following flow:
- The Page Report Studio service determines whether the requested operation is a restricted action. If it is, the Action Task Manager will take over the request. Otherwise, it will be processed directly, without being managed by the Action Task Manager.
- If the Concurrent Processing Table is full, the restricted request will be assigned to the Waiting Requests Queue. If the queue is full, the Page Report Studio service will refuse the request and return a warning message.
- After the request has been processed, it will be de-registered from the Concurrent Processing table. The Page Report Studio service will then automatically continue to process the requests in the Waiting Requests Queue.
By using the property file dhtml.properties provided in Page Report Studio, you can balance the server load by adjusting table sizes and specify which kind of requests are managed by the Action Task Manager to queue page report actions to ensure Page Report Studio features do not take too many system resources and impact other functions。
dhtml.properties
The dhtml.properties file is located at <install_root>\bin. It allows you to control three major options for the Action Task Manager:
- Specifying the size of the Concurrent Processing Table
Use queue.actions.max.concurrent=[integer] to set the maximum number of requests that can be processed simultaneously. The value of this property can be equal to or larger than 0. Use 0 (default) to disable the request queue feature.
- Specifying the size of the Waiting Requests Queue table
Use queue.actions.max.pending=[integer] to set the maximum number of to-be-handled requests that the queue can contain. The value of this property can be equal to or larger than 0. 0 means no requests will be stored in the queue. A request will either be handled by the Page Report Studio service or be rejected when the maximum limit of the Concurrent Processing table has been reached.
- Specifying the actions that can be applied for the Page Report Studio Request Queue feature
These are listed below:
queue.actions.init=false
          # Action: Page report initialization

          queue.actions.undo=true
          # Action: Undo

          queue.actions.redo=true
          # Action: Redo

          queue.actions.drill=true
          # Action: Drilling

          queue.actions.drillup=true
          # Action: Drilling up

          queue.actions.refresh=false
          # Action: Refreshing

          queue.actions.filter=true
          # Action: Filtering

          queue.actions.sort=true
          # Action: Sorting

          queue.actions.search=true
          # Action: Searching

          queue.actions.finishNewReport=true  # Action: Finishing
          creating a new report
These properties will only work when the queue feature has been enabled by setting queue.max.concurrent.actions>0.
True - The action will be handled by the Action Task Manager.
False - The action will not be handled by the Action Task Manager, but be directly processed by the Page Report Studio service without being queued.
Run
- Runs the report in the default format. If Report Studio is the default format, a web report will be opened in View Mode of Web Report Studio and a page report in Basic View of Page Report Studio.
- Runs the dashboard in the view mode of JDashboard.
- Runs the analysis template.
Configuring table pipeline
Table pipeline allows tables to show result as soon as there are data ready for the first page while partial summaries and the rest are still being processed in the background. By default, it is enabled on JReport Server to help speed up the rendering performance of tables in web reports and dashboards that involve millions of data records.
To configure table pipeline:
- Go to the Profile > Customize Profile > Common tab.
- The Table Pipeline option is checked by default.
- In the Table Block Refresh Time text box, specify the time interval in seconds for refreshing data so as to update partial data before the tables are fully ready.
- Click OK to save the changes.
Table pipeline can work in most cases. However when a table is applied component level sort and the Prefetch property of the business view the table uses is true, in order to make table pipeline take effect, the table and all the other data components in the same web report or dashboard that use the same business view should have the same component level sort setting: the same sort on field (sorting group by summary is excluded) and the same sort order.
In addition, if your report database is MySQL which fetches all data before returning the result set and JReport has to wait for the result set, the performance would not be much improved even when table pipeline is enabled. To solve the problem, you need to make fetch size work for MySQL in either ways:
- Set fetch size in the catalog database URL, for example, to set the fetch size to 20 records, the URL could be
jdbc:mysql://192.0.0.1:3306/test?useCursorFetch=true&defaultFetchSize=20.
- Set fetch size in your code after connecting to the database and before sending SQL as follows:
con = DriverManager.getConnection(url);

ps = (PreparedStatement) con.prepareStatement(sql,ResultSet.TYPE_FORWARD_ONLY,
ResultSet.CONCUR_READ_ONLY);

ps.setFetchSize(20);

ps.setFetchDirection(ResultSet.FETCH_REVERSE);

rs = ps.executeQuery();
|
 Previous Page Next Page
 Previous Page Next Page

