 Previous Page Next Page
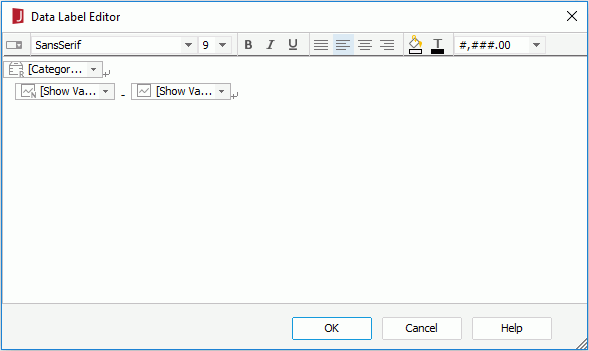
This editor appears when you click Edit Data Labels in the Data Label sub tab of the Range tab in the Format Category (X) Axis dialog for report or library component. It helps you to edit data labels in the range groups of a chart.

The following are details about options in the editor.
Toolbar
You can use the following toolbar buttons to edit the format of the data labels.
 Insert Drop-down List
 Font Face
 Font Size
 Style
Style Bold
Bold Italic
 Underline
 Justify
 Left
Left Center
 Right
Right Background Color
 Foreground Color
 Format Box
Data label edit box
You can edit the data labels you want to display on the range groups in this box. The box works like a special text box. A line in the box is a chart iterator, which is a special paragraph with markers or text.
To edit the data labels, select the information to show for each data label from the corresponding data label drop-down list. Click the Insert Drop-down List button  to insert more data labels if the existing ones cannot meet your requirement. To delete a data label, select it and press Backspace on the keyboard.
To insert an iterator after an existing iterator, click on the existing iterator to select it, then press the Enter key on the Keyboard. You can edit the content in a selected chart iterator, such as adding, deleting, or modifying markers and text segment in it. To edit the properties of an iterator, select it, right-click on the blank space and select Chart Iterator from the shortcut menu to edit the iterator in the Chart Iterator dialog.
OK
Applies the settings and closes the dialog.
Cancel
Cancels the settings and closes the dialog.
Help
Displays the help document about this feature.