 Previous Page Next Page
Summary Functions
The following are functions that can be used for creating summaries. They are divided into two types: normal functions and running functions. Both types of summaries are normally displayed in a group header, group footer, report header, or report footer and can be used in multiple places. If you want to see a running total on each detail line they can be put into the detail section as well.
A normal function calculates all records and returns only one fixed value that is reset to 0 for each group.
A running function calculates a value on each record and does not reset to 0 for each group. It is like the total sum of money for each transaction that is recorded on your checkbook. Each time you deposit or withdraw money from the bank, the record will compute the total of your checking account balance.
- Count
Total count of all the values in a field. For example, if you have six non-null fields in a group, the value generated by Count will be 6.
- Sum
This function sums up all the numerical values in a field. For example, if a field contains 5, 10, 15, 20 and 25, the Sum function will return 75.
- Minimum
This function finds the smallest numerical value in a field. For example, if a field contains 5, 10, 15, 20, and 25, the Minimum function will return 5.
- Maximum
This function finds the largest numerical value in a field. For example, if a field contains 5, 10, 15, 20, and 25, the Maximum function will return 25.
- Average
This function takes the average of all the numerical values in a field. For example, if a field contains 5, 10, 15, 20, and 25, the Average function will return 15.
- Distinct Count
This function takes a total count of all the distinct fields in a report. For example, if you have forty three fields in your report and three fields have identical values, the value generated by Distinct Count will be 41.
- Population Standard Deviation
This function uses the following equation to compute its value. PSD takes the square root of the Population Variance.

- Standard Deviation
This function uses the following equation to compute its value. SD takes the square root of the Variance.

- Population Variance
This function uses the following equation. PV sums up the square of the difference between a value and its average, and then divides the result by the total number of values.

- Variance
This function uses the following equation. Variance sums up the square of the difference between a value and its average, and then divides the result by the total number of values subtracted by one.

- Running Count
This function takes a total count on all of the records of the values in a field. It does not reset on each group break.
- Running Distinct Count
This function takes a distinct count on all of the records of the values in a field. It does not reset on each group break.
- Running Sum
This function sums up all the numerical values on all of the records in a field. It does not reset on each group break.
- Running Minimum
This function finds the smallest numerical value on all of the records in a field. It does not take the smallest numerical value of all the records in the query. The value you see is the smallest numerical value for the current and previous groups but not groups it hasn't read yet.
- Running Maximum
This function finds the largest numerical value in a field on running records. It does not take the largest numerical value of all the records in the query. The value you see is the largest numerical value for the current and previous groups but not groups it hasn't read yet.
- Running Average
This function takes the average of all the numerical values on all of the records in a field. It does not reset on each group break.
Examples
The following are two examples comparing normal functions and running functions.
Sum on table
Sum on crosstab
Sum on table
- Open the catalog file SampleReports.cat in
<install_root>\Demo\Reports\SampleReports.
- ClickFile > New > Web Report.
- Drag the Table (Group Left Above) button
 from the Components panel to the web report. The Create Table wizard appears.
- In the Data screen, select WorldWideSalesBV from Data Source 1.
- In the Display screen, add the fields Customer Name, Order ID, and Quantity to be dispalyed in the table.
- In the Group screen, add Country as the group-by field.
- In the Summary screen, go to the Dynamic Resources > Aggregations node, click <New Aggregation...>.
- In the New Aggregation dialog, click
 beside the Mapping Name text field and select Quantity as the mapping name, and then select RunningSum as the aggregate function. A default aggregation name RunningSum_Quantity is provided, click OK to create the aggregation.
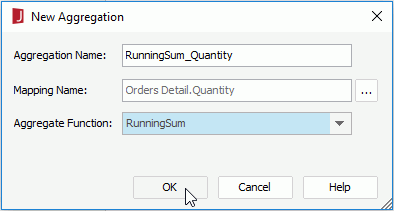
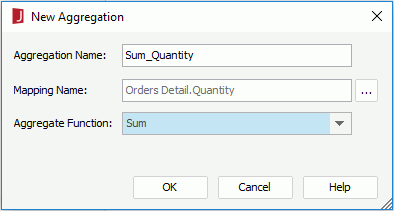
- Repeat the step above to create another aggregation named Sum_Quantity, which uses Quantity as the mapping name, and Sum as the aggregate function.
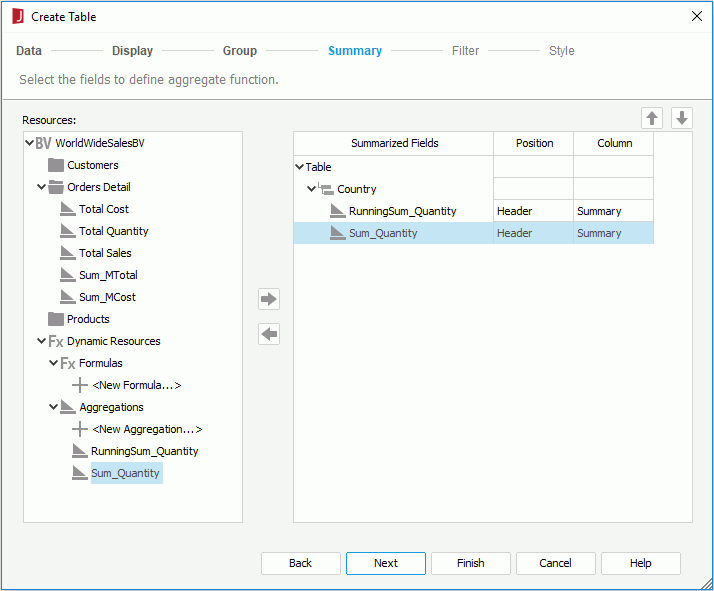
- In the sum on box on the right, select the Country group, add the two aggregations created above as the summary fields, and change their positions to Header so as to put them in the
group header.
- Click Finish. Then adjust the column width in the table to make the RunningSum_Quantity label fully displayed.
- Preview the table to check the summaries.
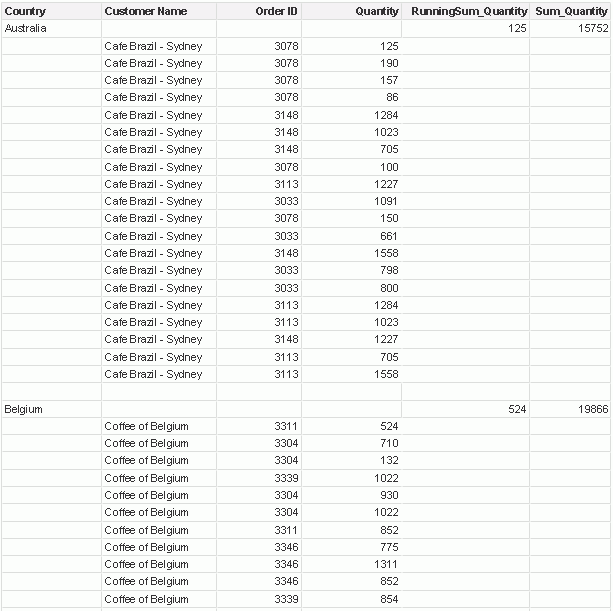
Sum on crosstab
- Open the catalog file SampleReports.cat in
<install_root>\Demo\Reports\SampleReports.
- Click File > New > Web Report.
- Drag the Crosstab button
 from the Components panel to the web report. The Create Crosstab wizard appears.
- In the Data screen of the wizard, select SaleStat from Data Source 1.
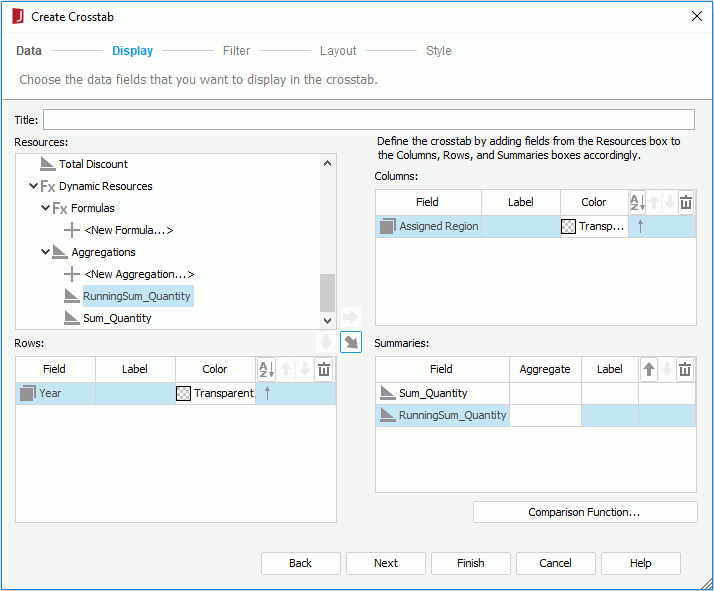
- In the Display screen, add the fields Assigned Region to the Columns box and Year to the Rows box, then create two dynamic aggregations RunningSum_Quantity and Sum_Quantity as described in steps 9 to 11 of the above example and add them as the summary fields.
- In the Style screen select Basic as the report style. Click Finish.
- To distinguish the two kinds of aggregate functions, select the four summary fields which use RunningSum as the aggregate function and set their Background property to Green.

- Preview the crosstab. The running summary values are highlighted in green for easy comparison.
Note that the running aggregate function is only supported on crosstab columns. It does not perform running totals on the row total values.

 Previous Page Next Page
 Previous Page Next Page


 from the Components panel to the web report. The Create Table wizard appears.
 beside the Mapping Name text field and select Quantity as the mapping name, and then select RunningSum as the aggregate function. A default aggregation name RunningSum_Quantity is provided, click OK to create the aggregation.


 from the Components panel to the web report. The Create Crosstab wizard appears.

