 Previous Page Next Page
Customizing the Crosstab Layout
When you create or edit a crosstab, you can use the Layout screen of the crosstab wizard to customize the layout of the crosstab according to specific data displayed in the crosstab so as to make the data more intuitive and readable.
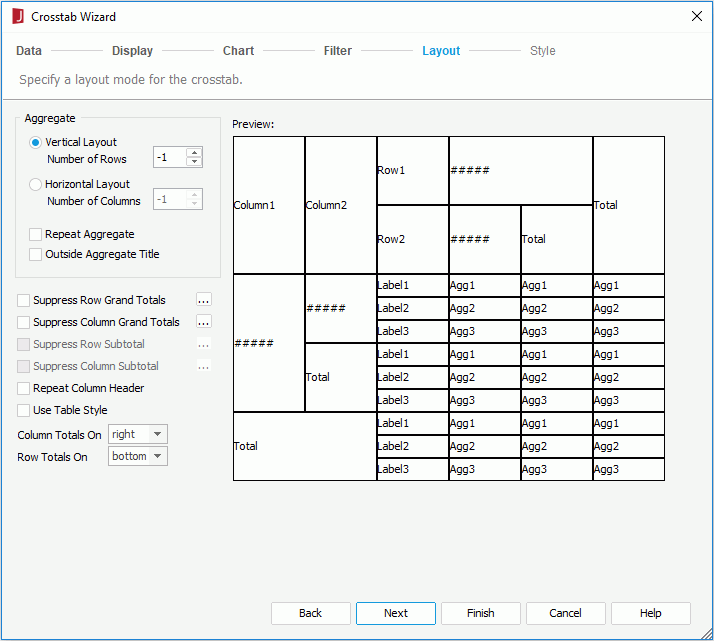
The following are properties that are provided in the Layout screen.
Aggregate
Specifies properties of the aggregate fields.
- Vertical Layout
If selected, the aggregate fields will be arranged vertically.
- Number of Rows
Specifies the number of rows to be displayed in the crosstab. By default, it is -1, which means that there is only one column with which to arrange the aggregate fields vertically; if it is set to 1, that means there will be only one row to arrange the aggregate fields horizontally; if it is set to a number larger than 1, that means there will be this number of aggregate rows to arrange all the aggregate fields horizontally; if this number is larger than the number of aggregate fields in the crosstab, it will be treated as -1.
- Horizontal Layout
If selected, the aggregate fields will be arranged horizontally.
Usually when there are multiple aggregates listed the horizontal layout is a more natural layout for users to view data as it looks more like a table.
- Number of Columns
Specifies the number of columns to be displayed in the crosstab. By default, it is -1, which means that there is only one row with which to arrange the aggregate fields horizontally; if it is set to 1, that means there will be only one column to arrange the aggregate fields vertically; if it is set to a number larger than 1, that means there will be this number of aggregate columns to arrange all the aggregate fields vertically; if this number is 0 or it is larger than the number of aggregate fields in the crosstab, it will be treated as -1.
- Repeat Aggregate
Specifies whether or not to repeat the crosstab for different aggregate fields. If checked, the value set for Number of Rows or Number of Columns will be ignored.
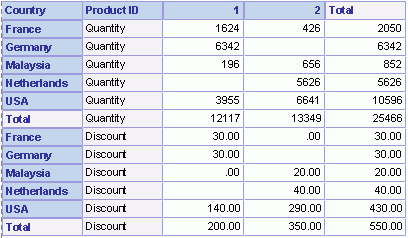
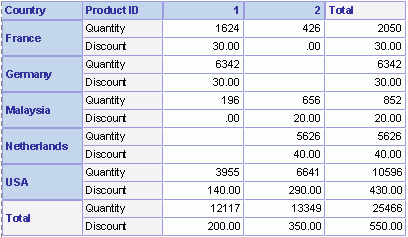
Assume that you have created a crosstab on the query WorldWideSales in the catalog file SampleReports.cat as follows: added Product ID as the column field, added Country as the row field, added Quantity and Discount as the aggregate fields and specified the functions as Sum, and applied the style Classic to the crosstab.
- If checked, one cell will contain only one aggregate field value, while for the other aggregate fields, the crosstab will repeat. The crosstab will be shown as follows:
- If unchecked, one crosstab cell accommodates the values of all aggregate fields. The crosstab will be shown as follows:
- Outside Aggregate Title
Specifies whether to place the summary label on the leftmost column when the aggregate layout is vertical, or on the topmost row of the crosstab when the aggregate layout is horizontal.
Suppress Row Grand Totals
Specifies whether or not to show the grand totals of row groups. If required, you can click  to open the Suppress Row Grand Totals dialog to specify which grand totals of the row groups will be suppressed and which will be shown.
Suppress Column Grand Totals
Specifies whether or not to show the grand totals of column groups. If required, you can click  to open the Suppress Column Grand Totals dialog to specify which grand totals of the column groups will be suppressed and which will be shown.
Suppress Row Subtotal
Specifies whether or not to show the subtotals of rows. If required, you can click  to open the Suppress Row Subtotal dialog to specify which subtotals of the rows will be suppressed and which will be shown.
Suppress Column Subtotal
Specifies whether or not to show the subtotals of columns. If required, you can click  to open the Suppress Column Subtotal dialog to specify which subtotals of the columns will be suppressed and which will be shown.
Repeat Column Header
Specifies whether or not the header of columns will appear on every page, if a crosstab spans more than one page.
Use Table Style
Specifies whether to add headers to the Total rows and columns.
Column Totals On
Specifies the position of total columns on the left or right of the aggregates.
Row Totals On
Specifies the position of total rows on the top or bottom of the aggregates.
Besides using the wizard, you can also customize the layout of a crosstab in a page report, web report or library component by setting properties in the Report Inspector.
Example of customizing the crosstab layout
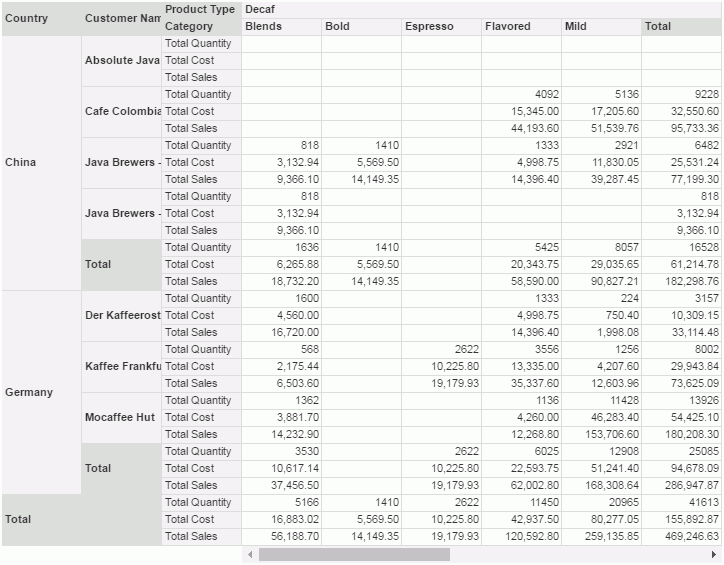
Suppose you want to have a crosstab to show the total cost, quantity and sales of different product categories and types for different customers in China and Germany, you can create it as follows:
- Open the catalog file SampleReports.cat in
<install_root>\Demo\Reports\SampleReports.
- Create a web report.
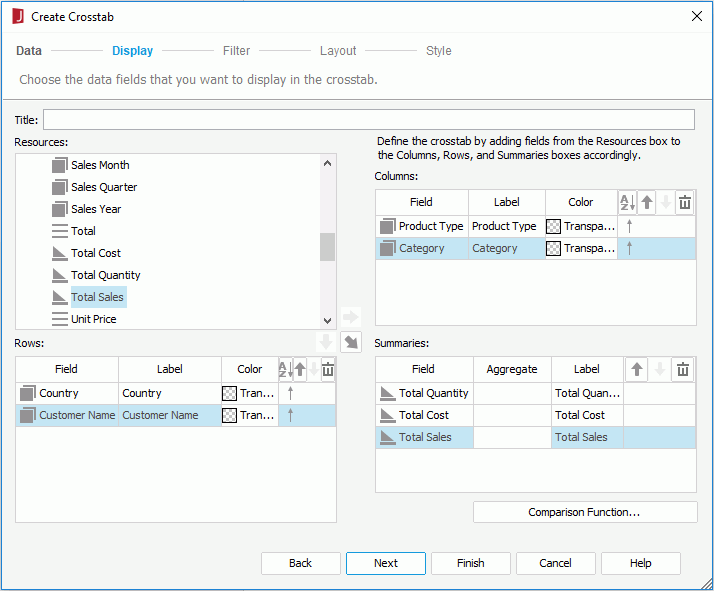
- Insert a crosstab in the web report as follows: use WorldWideSalesBV in Data Source 1, show Product Type and Category in the Products table on the columns, Country and Customer Name in the Customers table on the rows, Total Quantity, Total Cost and Total Sales as the aggregate fields, specify the field names as the display names to label the rows, columns and summaries, and add a filter condition @Country = China Or @Country = Germany.
- Save the report and click View > Preview As > Web Report Result to preview the report and it appears as follows:
- Close the report and return to the Design tab in JReport Designer.
- Right-click the crosstab and select Crosstab Wizard from the shortcut menu.
- In the Crosstab Wizard, click Layout to switch to the screen.
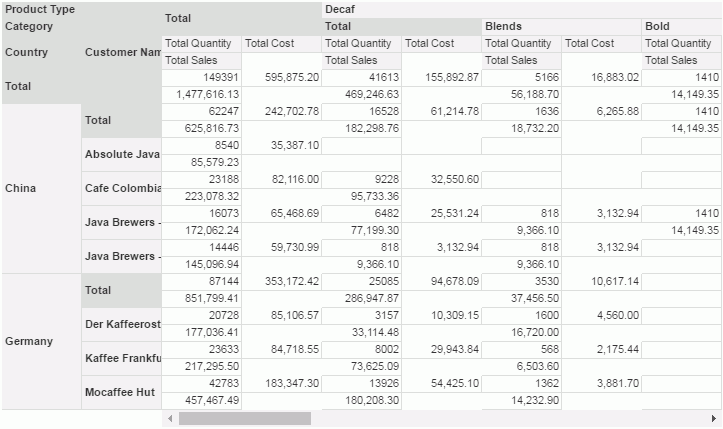
- Check Repeat Aggregate to show the aggregate field values for each customer in their own cells.
- Check Horizontal Layout to arrange the aggregate fields horizontally and specify the option Number of Columns to 2.
- Select left from the Column Totals On drop-down list and top from the Row Totals On drop-down list.
It is better to uncheck Outside Aggregate Title, as the labels of the aggregate fields would be far from their values. It is also suggested that you uncheck Use Table Style, otherwise the row and column headers will be repeated too much. As for suppress related properties, you can specify them as required. You can decide which part of the aggregate field values to see. Here, we keep the default settings of these properties.
- Save the report and preview it again. The crosstab now appears as follows:
 Previous Page Next Page
 Previous Page Next Page


 to open the Suppress Row Grand Totals dialog to specify which grand totals of the row groups will be suppressed and which will be shown.
 to open the Suppress Column Grand Totals dialog to specify which grand totals of the column groups will be suppressed and which will be shown.
 to open the Suppress Row Subtotal dialog to specify which subtotals of the rows will be suppressed and which will be shown.
 to open the Suppress Column Subtotal dialog to specify which subtotals of the columns will be suppressed and which will be shown.

