BackPrevious Page Next PageNext

Formatting the Scatter Chart

To format a scatter chart, follow the steps below:
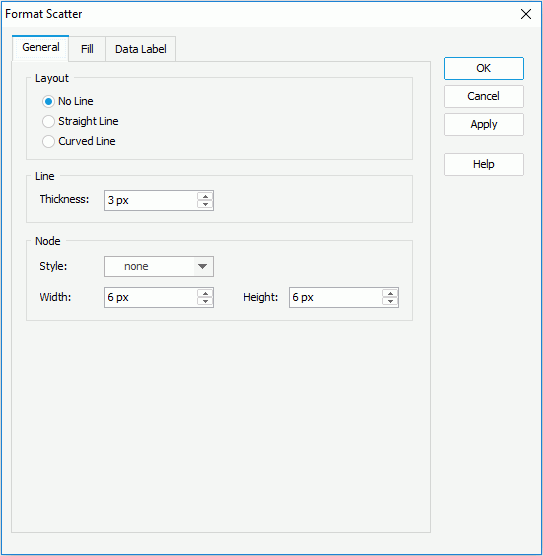
  1. Right-click any node in the scatter chart, and then click Format Scatter on the shortcut menu to bring up the Format Scatter dialog.

    Format Scatter dialog - General tab

  2. In the General tab, set the general options for the scatter chart.

    In the Layout box, specify the layout of the chart. In the Line box, specify the thickness of the lines that connect the nodes if you have set the layout to Straight Line or Curved Line. In the Node box, set the node style, width and height as required.
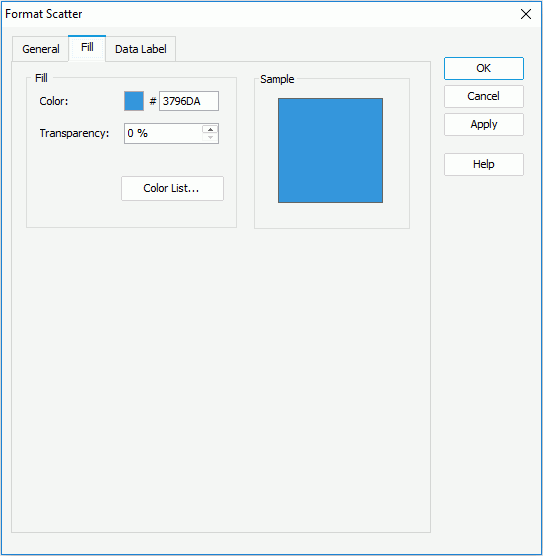
  3. In the Fill tab, specify the color and transparency of the color schema to fill the selected scatter markers in the same data series (to change the color, click the color image and select a color from the color palette or input the hexadecimal value of a color directly in the text box). You can also click the Color List button to specify the color pattern for scatter markers in the same data series respectively in the Color List dialog.

    Format Scatter dialog - Fill tab

  4. In the Data Label tab, set the font formats and effects of the data labels.
  5. Click OK to apply the settings and close the dialog.

BackPrevious Page Next PageNext