 Previous Page Next Page
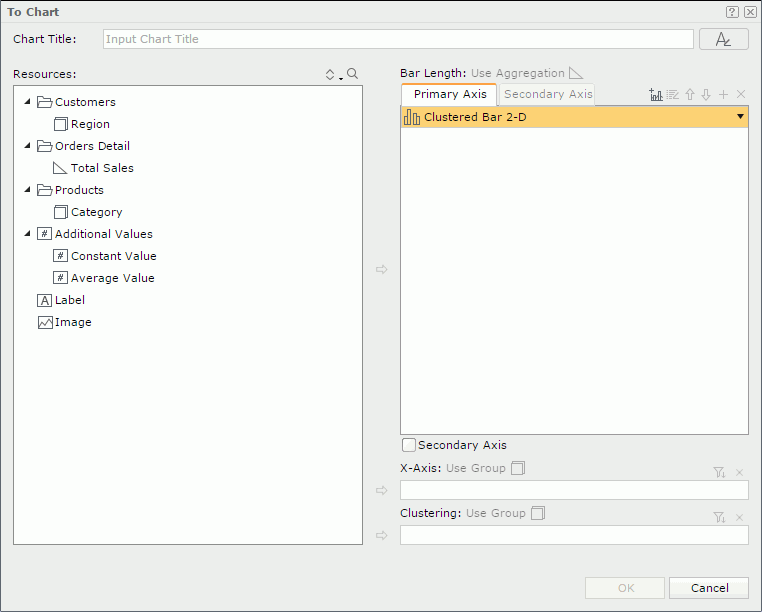
This dialog appears when you right-click a crosstab and then select To Chart on the shortcut menu or click Menu > Edit > To Chart. It allows you to specify settings for converting a crosstab into a chart excluding the organization chart and varies with different chart types: common chart types, organization chart, heat map.
OK
Applies the settings and closes the dialog.
Cancel
Cancels the settings and closes the dialog.

Displays the help document about this feature.

Ignores the setting and closes this dialog.
Title
Specifies a title for the chart.

Specifies the font properties of the chart title.
Resources
Displays all the view elements used in the crosstab.

Sorts the view elements in the specified order from the drop-down list. Once a user changes the order, it will be applied to all the resource trees where business view elements are listed for this user.

Launches the quick search toolbar to search for view elements. For the usage of the toolbar click here.

Adds the selected group or aggregation object to be displayed in the chart.
Category box
The actual name of the box varies with different chart types, for example, it is X-Axis for a clustered bar chart. The box lists the group object  that will be displayed on the category axis of the chart.
Series box
The actual name of the box varies with different chart types, for example, it is Clustering for a clustered bar chart. The box lists the group object that will be displayed on the series axis of the chart.
Value box
The actual name of the box varies with different chart types, for example, it is Bar Length for a clustered bar chart. The box specifies the types for chart and sets the values for the Primary Axis or Secondary Axis separately.
Secondary Axis
Specifies whether to show the secondary axis in the chart.

Opens the Category Options dialog or Series Options dialog to define the sort order of the category or series values and specify the number of the category or series values that will be displayed in the chart.

Adds a combo chart to the Primary Axis or Secondary Axis.

Moves the selected view element one level up.

Moves the selected view element one level down.

Adds a new pair of Y Axis and Radius for the bubble chart.

Removes the selected view element.
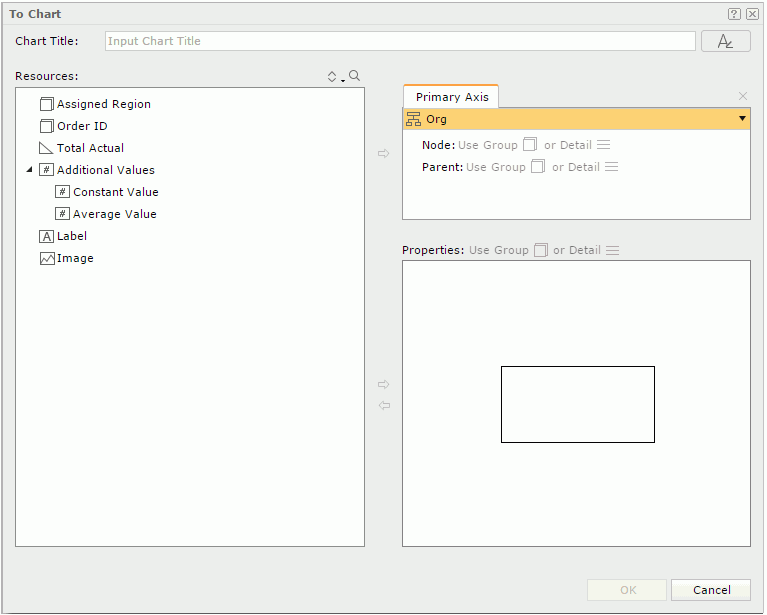
Chart Title
Specifies the title of the chart. The title is a special label bound with the chart. Though it can be positioned freely in a report, once you remove the chart from the report, the title will be removed too.
Specifies the font properties of the chart title.
Resources
Displays the resources that can be added to the chart.
Sorts the view elements in the specified order from the drop-down list. Once a user changes the order, it will be applied to all the resource trees where business view elements are listed for this user.
Launches the quick search toolbar to search for view elements. For the usage of the toolbar click here.
Value box
. . Properties
The Properties box presents a node model of the org chart. Data fields, labels and images can be inserted into the node as the information about the entity in the org chart, by using . By default all added objects are placed at the left top of the node, you need to adjust their positions and sizes in the node. You can also resize the node if required.
To remove an object from the node, select it and then click  .
.
Title
Specifies the title of the chart. The title is a special label bound with the chart. Though it can be positioned freely in a report, once you remove the chart from the report, the title will be removed too.
Specifies the font properties of the chart title.
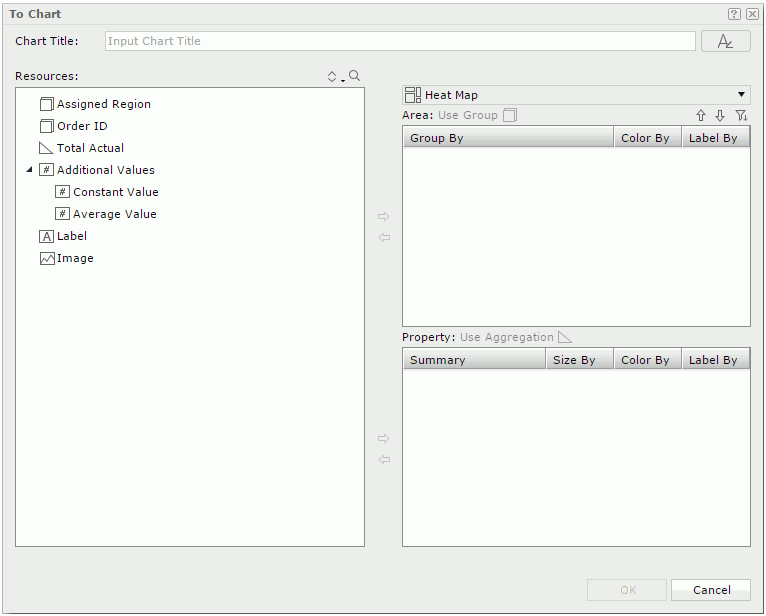
Resources
Displays the resources that can be added to the chart.
Sorts the view elements in the specified order from the drop-down list. Once a user changes the order, it will be applied to all the resource trees where business view elements are listed for this user.
Launches the quick search toolbar to search for view elements. For the usage of the toolbar click here.
Adds the selected field into the Area or Property box.
Removes the selected field from the Area or Property box.
Chart type drop-down list
Displays Heat Map as the selected chart type.
Area
Lists the fields used to group the data to different areas. There should be at least one group. When there are multiple groups, their levels are defined by their positions from top down. The group at the top is of the highest level and the bottom the lowest.
Property
Lists the summary fields used as size-by/color-by or displayed in the innermost rectangle.