 Previous Page Next Page
If your JReport Server is enabled with Visual Analysis, you can access Visual Analysis directly from JDashboard without having to switch to the user console page. Visual Analysis is loaded in JDashboard as a tab with full functionality for you to perform data analysis with.
There are several ways to access Visual Analysis:
 and then select New Analysis.
  and then select New > Analysis.
 You can take the following ways to access Visual Analysis for a specific analysis template.
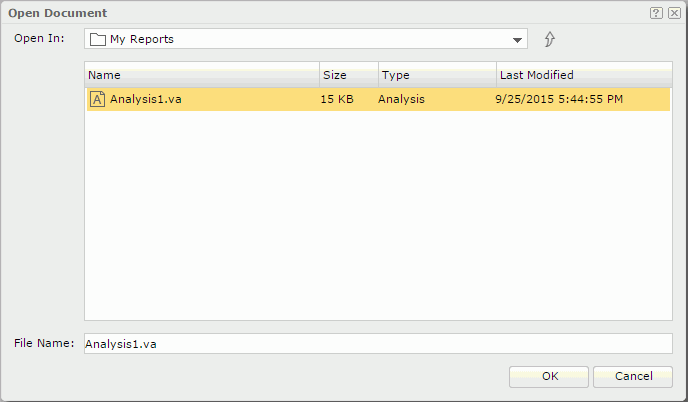
Using dialog
 on the toolbar, or click the Options button
  and select Open from the option list. The Open Document dialog appears.

Using the Resources panel
In JDashboard click Show Resources  on the toolbar to open the Resources panel. Then in the Reports node, browse to the target analysis template with .va as the suffix and drag it to the editing area, Visual Analysis will be loaded in a new dashboard tab with the selected analysis template displayed.
Using component title bar
After an analysis template is inserted in a dashboard as its component, click  on the component title bar, focus on Analyze on the drop-down menu, and then choose an option:
Note that the changes made on the analysis template in Visual Analysis will be saved to the server resource tree, however they will not be reflected on the one inserted as component in the dashboard.